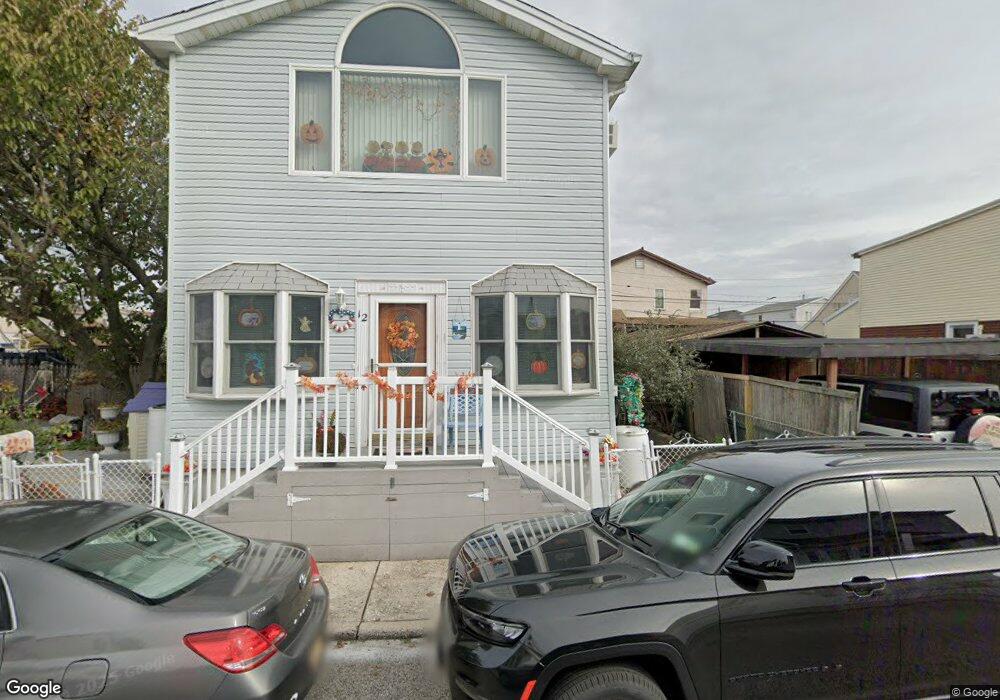
12 Hazel Ct Brooklyn, NY 11229
Gerritsen Beach NeighborhoodEstimated Value: $724,356 - $866,000
Studio
--
Bath
1,600
Sq Ft
$497/Sq Ft
Est. Value
About This Home
This home is located at 12 Hazel Ct, Brooklyn, NY 11229 and is currently estimated at $795,839, approximately $497 per square foot. 12 Hazel Ct is a home located in Kings County with nearby schools including P.S. 277 Gerritsen Beach, J.H.S. 278 Marine Park, and New Visions Charter High School for Advanced Math/ Science.
Ownership History
Date
Name
Owned For
Owner Type
Purchase Details
Closed on
Nov 9, 2006
Sold by
Ankro Eugen E and Ankro Harald K
Bought by
Cortez Jimmy and Cortez Yadira P
Current Estimated Value
Home Financials for this Owner
Home Financials are based on the most recent Mortgage that was taken out on this home.
Original Mortgage
$456,000
Interest Rate
6.39%
Mortgage Type
Purchase Money Mortgage
Create a Home Valuation Report for This Property
The Home Valuation Report is an in-depth analysis detailing your home's value as well as a comparison with similar homes in the area
Home Values in the Area
Average Home Value in this Area
Purchase History
| Date | Buyer | Sale Price | Title Company |
|---|---|---|---|
| Cortez Jimmy | $570,000 | -- | |
| Cortez Jimmy | $570,000 | -- |
Source: Public Records
Mortgage History
| Date | Status | Borrower | Loan Amount |
|---|---|---|---|
| Previous Owner | Cortez Jimmy | $456,000 |
Source: Public Records
Tax History
| Year | Tax Paid | Tax Assessment Tax Assessment Total Assessment is a certain percentage of the fair market value that is determined by local assessors to be the total taxable value of land and additions on the property. | Land | Improvement |
|---|---|---|---|---|
| 2025 | $5,425 | $40,920 | $14,220 | $26,700 |
| 2024 | $5,425 | $39,300 | $14,220 | $25,080 |
| 2023 | $5,167 | $42,060 | $14,220 | $27,840 |
| 2022 | $4,768 | $38,940 | $14,220 | $24,720 |
| 2021 | $5,033 | $33,180 | $14,220 | $18,960 |
| 2020 | $2,011 | $29,340 | $14,220 | $15,120 |
| 2019 | $3,762 | $29,280 | $14,220 | $15,060 |
| 2018 | $4,262 | $22,368 | $8,106 | $14,262 |
| 2017 | $4,002 | $21,103 | $8,963 | $12,140 |
| 2016 | $3,909 | $21,103 | $9,245 | $11,858 |
| 2015 | $2,181 | $20,775 | $11,305 | $9,470 |
| 2014 | $2,181 | $19,730 | $10,737 | $8,993 |
Source: Public Records
Map
Nearby Homes
Your Personal Tour Guide
Ask me questions while you tour the home.