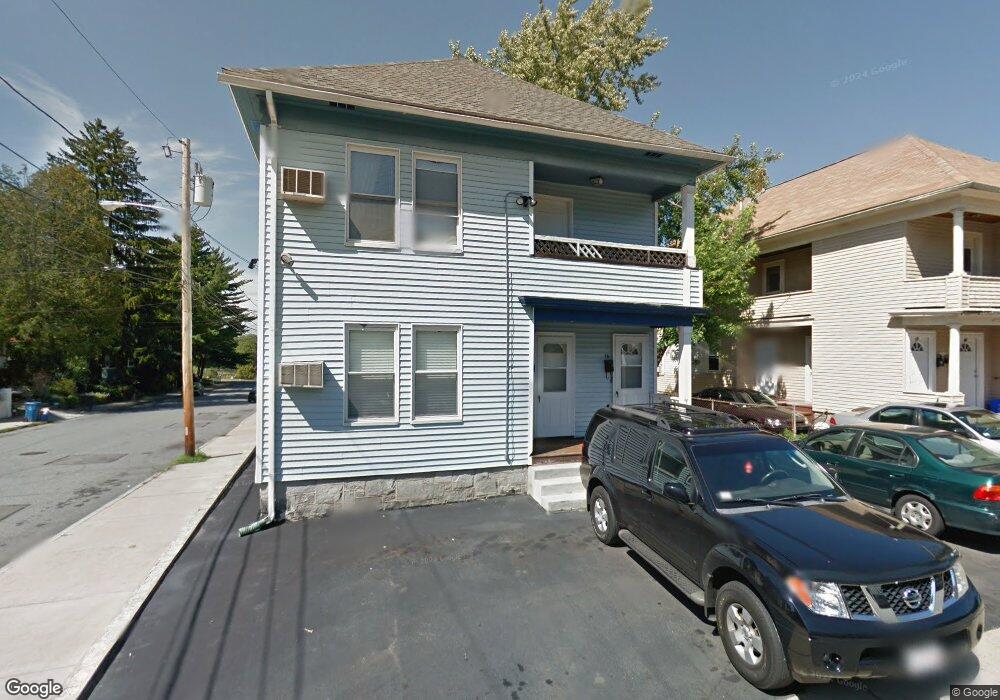
12 Hilltop Ave Unit 14 Lawrence, MA 01841
Tower Hill NeighborhoodEstimated Value: $592,000 - $688,000
4
Beds
2
Baths
2,538
Sq Ft
$250/Sq Ft
Est. Value
About This Home
This home is located at 12 Hilltop Ave Unit 14, Lawrence, MA 01841 and is currently estimated at $634,970, approximately $250 per square foot. 12 Hilltop Ave Unit 14 is a home located in Essex County with nearby schools including Cass Lake-Bena Elementary School, Olive Branch Elementary School, and James F. Hennessey School.
Ownership History
Date
Name
Owned For
Owner Type
Purchase Details
Closed on
Aug 4, 2016
Sold by
Rivera Maria A and Rivera Vicky M
Bought by
Rivera Maria A and Rivera Nelson
Current Estimated Value
Purchase Details
Closed on
Dec 6, 2002
Sold by
Morel Jose A and Morel Somara
Bought by
Rivera Maria A and Rivera Vicky M
Home Financials for this Owner
Home Financials are based on the most recent Mortgage that was taken out on this home.
Original Mortgage
$236,292
Interest Rate
6.34%
Mortgage Type
Purchase Money Mortgage
Purchase Details
Closed on
Jul 6, 1999
Sold by
Munson Lee C and Isley Ellen M
Bought by
Morel Jose A and Morel Somara
Home Financials for this Owner
Home Financials are based on the most recent Mortgage that was taken out on this home.
Original Mortgage
$114,059
Interest Rate
7.19%
Mortgage Type
Purchase Money Mortgage
Create a Home Valuation Report for This Property
The Home Valuation Report is an in-depth analysis detailing your home's value as well as a comparison with similar homes in the area
Home Values in the Area
Average Home Value in this Area
Purchase History
| Date | Buyer | Sale Price | Title Company |
|---|---|---|---|
| Rivera Maria A | -- | -- | |
| Rivera Maria A | $240,000 | -- | |
| Morel Jose A | $115,000 | -- |
Source: Public Records
Mortgage History
| Date | Status | Borrower | Loan Amount |
|---|---|---|---|
| Previous Owner | Morel Jose A | $236,292 | |
| Previous Owner | Morel Jose A | $180,000 | |
| Previous Owner | Morel Jose A | $114,059 |
Source: Public Records
Tax History Compared to Growth
Tax History
| Year | Tax Paid | Tax Assessment Tax Assessment Total Assessment is a certain percentage of the fair market value that is determined by local assessors to be the total taxable value of land and additions on the property. | Land | Improvement |
|---|---|---|---|---|
| 2025 | $5,186 | $589,300 | $106,400 | $482,900 |
| 2024 | $4,883 | $527,900 | $102,900 | $425,000 |
| 2023 | $5,045 | $496,600 | $90,100 | $406,500 |
| 2022 | $4,444 | $388,500 | $83,700 | $304,800 |
| 2021 | $4,325 | $352,500 | $83,700 | $268,800 |
| 2020 | $4,053 | $326,100 | $70,900 | $255,200 |
| 2019 | $3,958 | $289,300 | $61,400 | $227,900 |
| 2018 | $3,848 | $268,700 | $58,700 | $210,000 |
| 2017 | $3,488 | $227,400 | $56,700 | $170,700 |
| 2016 | $3,515 | $226,600 | $40,300 | $186,300 |
| 2015 | $3,322 | $219,700 | $40,300 | $179,400 |
Source: Public Records
Map
Nearby Homes
- 50 Forest St
- 499 Haverhill St
- 62-66 Butler St
- 44-46 Butler St
- 70 Butler St
- 42 Morton St
- 2 Maurice Ave
- 265 Ames St
- 47 Hallenan Ave
- 139 West St
- 68 Middlebury St
- 2 Washington St
- 30-32 Linden St
- 179-181 West St
- 1008 Essex St Unit 1010
- 45 Bodwell St
- 202 Broadway Unit 2-3
- 202 Broadway Unit 3-3
- 88-90 Columbus Ave
- 14-16 Cypress Ave
- 12-14 Hilltop Ave
- 16 Hilltop Ave Unit 18
- 53-53A Bellevue St
- 53-5 Bellevue St
- 53 Bellevue St
- 53 Bellevue St Unit 1
- 45 Bellevue St Unit 47
- 53-53 A Bellevue
- 53 -53A Bellevue St
- 20-22 Hilltop Ave
- 20 Hilltop Ave Unit 22
- 54 Bellevue St
- 48-50 Bellevue St
- 58-60 Bellevue St
- 58 Bellevue St Unit 60
- 41 Bellevue St Unit 43
- 41-43 Bellevue St
- 58 Bellevue St
- 48 Bellevue St Unit 50
- 54 Bellevue St Unit 56