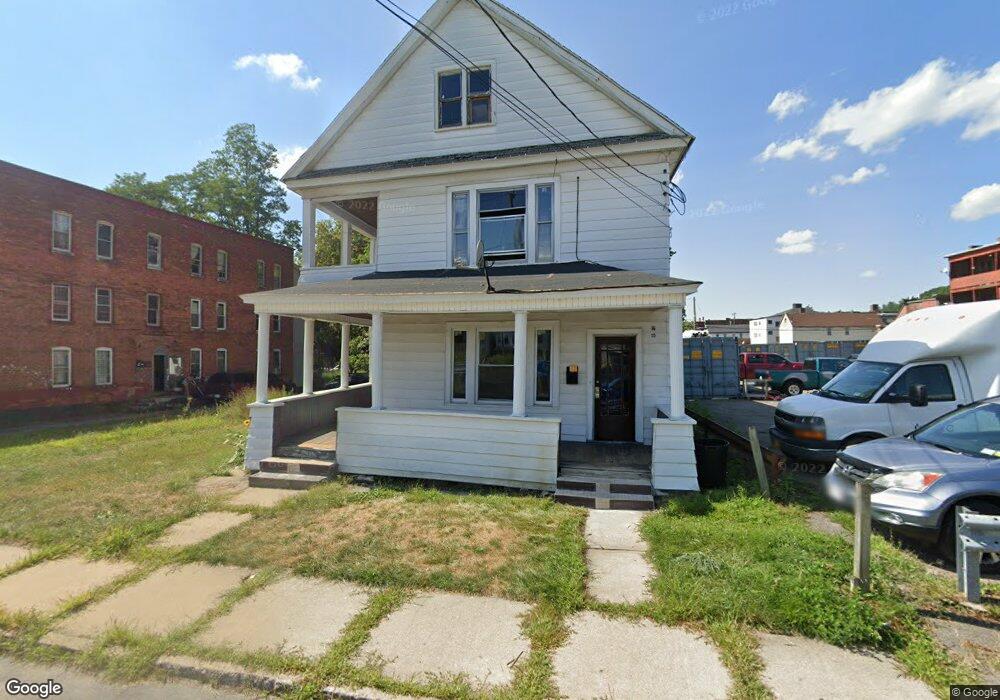
12 John St Amsterdam, NY 12010
Estimated Value: $104,000 - $135,088
6
Beds
2
Baths
2,536
Sq Ft
$47/Sq Ft
Est. Value
About This Home
This home is located at 12 John St, Amsterdam, NY 12010 and is currently estimated at $119,522, approximately $47 per square foot. 12 John St is a home located in Montgomery County with nearby schools including Amsterdam High School and St. Mary's Institute.
Ownership History
Date
Name
Owned For
Owner Type
Purchase Details
Closed on
Sep 18, 2024
Sold by
Uz Mgmt Llc
Bought by
Vivian L Mullins Lt and Allah
Current Estimated Value
Purchase Details
Closed on
Sep 18, 2017
Sold by
Iqbal Uzma
Bought by
Uz Mgmt Llc
Purchase Details
Closed on
Feb 27, 2017
Sold by
City Of Amsterdam
Bought by
Iqbal Uzma
Purchase Details
Closed on
Jan 8, 2016
Sold by
Agresta - As Controller Matthew A
Bought by
City Of Amsterdam
Purchase Details
Closed on
Aug 16, 2005
Sold by
Ilyas Salahuddin
Bought by
Upstate Properties Llc
Purchase Details
Closed on
May 20, 2004
Sold by
Us Dept Of Hud
Bought by
Ilyas Salahuddin
Purchase Details
Closed on
Jan 29, 2004
Sold by
Referee Landon Douglas
Bought by
Hud
Purchase Details
Closed on
Jul 18, 1996
Create a Home Valuation Report for This Property
The Home Valuation Report is an in-depth analysis detailing your home's value as well as a comparison with similar homes in the area
Home Values in the Area
Average Home Value in this Area
Purchase History
| Date | Buyer | Sale Price | Title Company |
|---|---|---|---|
| Vivian L Mullins Lt | $120,000 | None Available | |
| Uz Mgmt Llc | -- | None Available | |
| Uz Mgmt Llc | -- | None Available | |
| Iqbal Uzma | $2,240 | -- | |
| Iqbal Uzma | $2,240 | -- | |
| City Of Amsterdam | $11,038 | William Lorman | |
| City Of Amsterdam | $11,038 | William Lorman | |
| Upstate Properties Llc | $24,500 | Robert Hoffman | |
| Upstate Properties Llc | $24,500 | Robert Hoffman | |
| Ilyas Salahuddin | $13,300 | None | |
| Ilyas Salahuddin | $13,300 | None | |
| Hud | $75,352 | Balin Certilman | |
| Hud | $75,352 | Balin Certilman | |
| -- | $75,352 | -- | |
| -- | $75,352 | -- |
Source: Public Records
Tax History Compared to Growth
Tax History
| Year | Tax Paid | Tax Assessment Tax Assessment Total Assessment is a certain percentage of the fair market value that is determined by local assessors to be the total taxable value of land and additions on the property. | Land | Improvement |
|---|---|---|---|---|
| 2024 | $1,669 | $31,700 | $1,100 | $30,600 |
| 2023 | $1,601 | $31,700 | $1,100 | $30,600 |
| 2022 | $1,307 | $31,700 | $1,100 | $30,600 |
| 2021 | $1,529 | $31,700 | $1,100 | $30,600 |
| 2020 | $1,435 | $31,700 | $1,100 | $30,600 |
| 2019 | $823 | $31,700 | $1,100 | $30,600 |
| 2018 | $2,858 | $31,700 | $1,100 | $30,600 |
| 2017 | $5,836 | $31,700 | $1,100 | $30,600 |
| 2016 | $1,399 | $31,700 | $1,100 | $30,600 |
| 2015 | -- | $31,700 | $1,100 | $30,600 |
| 2014 | -- | $31,700 | $1,100 | $30,600 |
Source: Public Records
Map
Nearby Homes