Estimated Value: $2,411,808 - $2,875,000
3
Beds
2
Baths
2,645
Sq Ft
$975/Sq Ft
Est. Value
About This Home
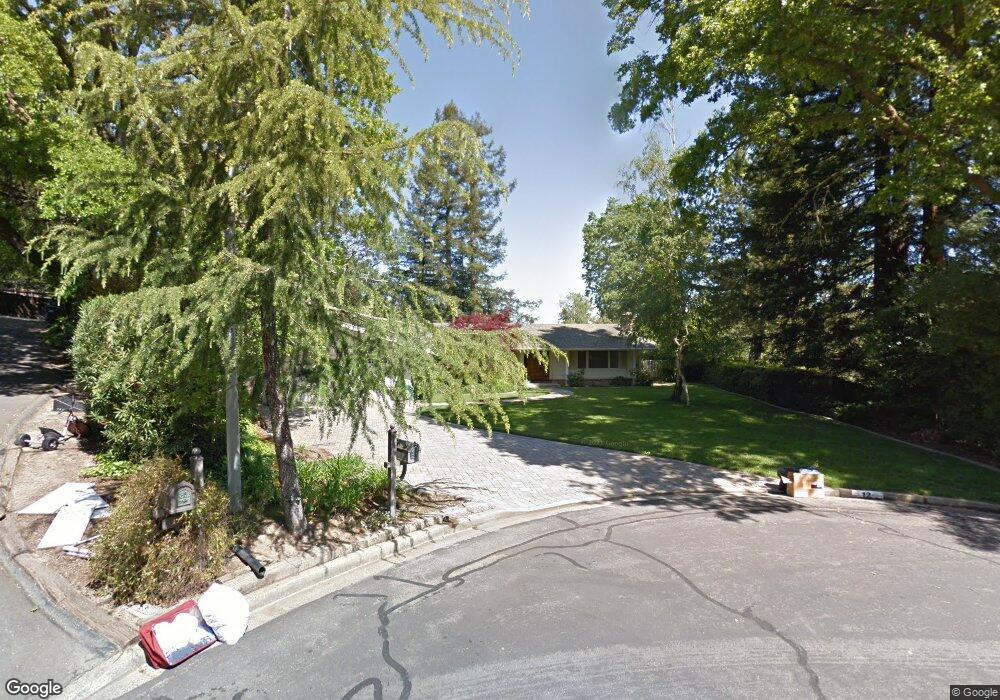
This home is located at 12 Kirk Ct, Alamo, CA 94507 and is currently estimated at $2,578,202, approximately $974 per square foot. 12 Kirk Ct is a home located in Contra Costa County with nearby schools including Stone Valley Middle School, San Ramon Valley High School, and San Ramon Valley Christian Academy.
Ownership History
Date
Name
Owned For
Owner Type
Purchase Details
Closed on
Apr 10, 1998
Sold by
Loukianoff Nicholas A and Loukianoff V
Bought by
Louklanoff Nicholas A and Louklanoff Valentina
Current Estimated Value
Home Financials for this Owner
Home Financials are based on the most recent Mortgage that was taken out on this home.
Original Mortgage
$300,000
Interest Rate
7.07%
Mortgage Type
Purchase Money Mortgage
Purchase Details
Closed on
Apr 2, 1998
Sold by
Loukianoff Nicholas A and Loukianoff V
Bought by
Loukianoff Nicholas A and Loukianoff Valentina
Home Financials for this Owner
Home Financials are based on the most recent Mortgage that was taken out on this home.
Original Mortgage
$300,000
Interest Rate
7.07%
Mortgage Type
Purchase Money Mortgage
Purchase Details
Closed on
Jun 7, 1995
Sold by
Loukianoff Nicholas A and Loukianoff Valentina
Bought by
Loukianoff Nicholas A and Loukianoff Valentina
Create a Home Valuation Report for This Property
The Home Valuation Report is an in-depth analysis detailing your home's value as well as a comparison with similar homes in the area
Home Values in the Area
Average Home Value in this Area
Purchase History
| Date | Buyer | Sale Price | Title Company |
|---|---|---|---|
| Louklanoff Nicholas A | -- | -- | |
| Loukianoff Nicholas A | -- | First American Title Guarant | |
| Loukianoff Nicholas A | -- | -- |
Source: Public Records
Mortgage History
| Date | Status | Borrower | Loan Amount |
|---|---|---|---|
| Closed | Loukianoff Nicholas A | $300,000 |
Source: Public Records
Tax History
| Year | Tax Paid | Tax Assessment Tax Assessment Total Assessment is a certain percentage of the fair market value that is determined by local assessors to be the total taxable value of land and additions on the property. | Land | Improvement |
|---|---|---|---|---|
| 2025 | $3,473 | $229,338 | $48,999 | $180,339 |
| 2024 | $3,332 | $224,842 | $48,039 | $176,803 |
| 2023 | $3,332 | $220,435 | $47,098 | $173,337 |
| 2022 | $3,306 | $216,114 | $46,175 | $169,939 |
| 2021 | $3,227 | $211,877 | $45,270 | $166,607 |
| 2019 | $3,076 | $205,594 | $43,928 | $161,666 |
| 2018 | $2,961 | $201,564 | $43,067 | $158,497 |
| 2017 | $2,847 | $197,613 | $42,223 | $155,390 |
| 2016 | $2,787 | $193,740 | $41,396 | $152,344 |
| 2015 | $2,733 | $190,831 | $40,775 | $150,056 |
| 2014 | $2,677 | $187,094 | $39,977 | $147,117 |
Source: Public Records
Map
Nearby Homes
- 104 Muir Ln
- 1015 Ironwood Place
- 11 Xavier Ct
- 348 Del Amigo Rd
- 700 Clipper Hill Rd
- 428 Marian Ln
- 475 Starview Dr
- 122 Briar Place
- 162 Briar Place
- 230 El Pinto Unit A1
- 4 La Serena Way
- 165 Rubicon Cir Unit 17
- 477 Veda Dr
- 35 Danville Oak Place
- 315 Garden Creek Place
- 57 Danville Oak Place Unit 57
- 0 Lark Ln Unit 41120351
- 1384 Danville Blvd
- 413 Shirlee Dr
- 45 Lark Place
- 933 Kirkcrest Rd
- 18 Kirk Ct
- 910 Camille Ln
- 915 Underhill Dr
- 19 Kirk Ct
- 937 Kirkcrest Rd
- 11 Kirk Ct
- 900 Underhill Dr
- 920 Camille Ln
- 925 Underhill Dr
- 932 Kirkcrest Rd
- 943 Kirkcrest Rd
- 4 Ashford Ct
- 10 Ashford Ct
- 911 Camille Ln
- 928 Kirkcrest Rd
- 910 Underhill Dr
- 935 Underhill Dr
- 930 Camille Ln
- 920 Underhill Dr
Your Personal Tour Guide
Ask me questions while you tour the home.