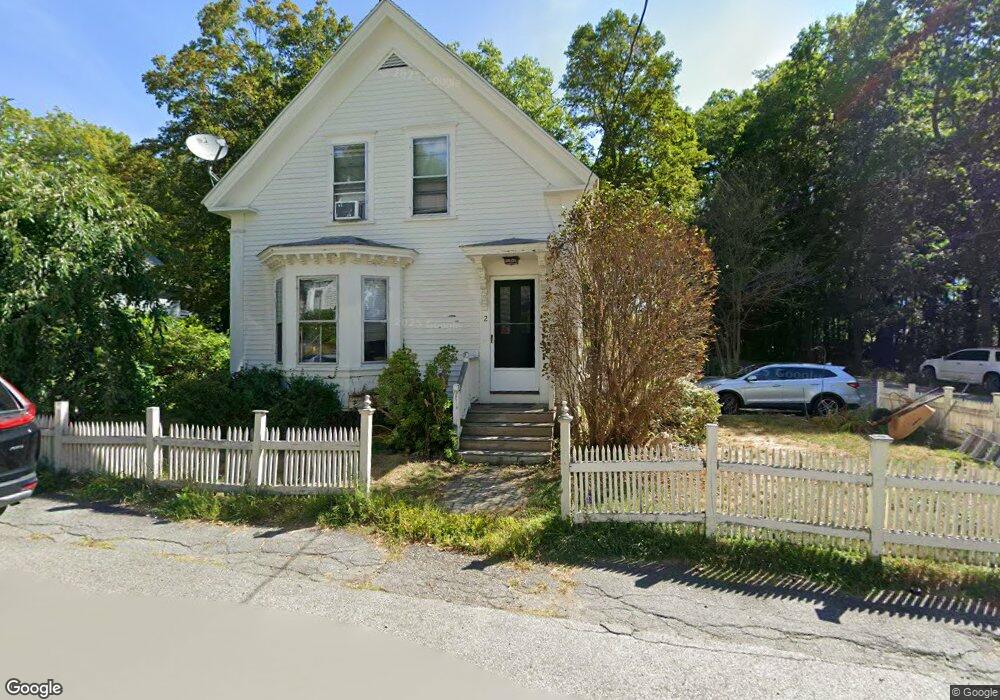
12 Lawrence St Ashburnham, MA 01430
Estimated Value: $300,459 - $413,000
4
Beds
2
Baths
1,366
Sq Ft
$258/Sq Ft
Est. Value
About This Home
This home is located at 12 Lawrence St, Ashburnham, MA 01430 and is currently estimated at $352,865, approximately $258 per square foot. 12 Lawrence St is a home located in Worcester County with nearby schools including Oakmont Regional High School and Cushing Academy.
Ownership History
Date
Name
Owned For
Owner Type
Purchase Details
Closed on
Feb 28, 2001
Sold by
Wilson John H and Wilson Donna J
Bought by
Kallio Kyle S and Kallio Danielle P
Current Estimated Value
Home Financials for this Owner
Home Financials are based on the most recent Mortgage that was taken out on this home.
Original Mortgage
$126,875
Outstanding Balance
$46,130
Interest Rate
7%
Mortgage Type
Purchase Money Mortgage
Estimated Equity
$306,735
Purchase Details
Closed on
Jul 23, 1998
Sold by
Rocheleau Daniel P
Bought by
Driscoll Timothy and Driscoll Patricia
Home Financials for this Owner
Home Financials are based on the most recent Mortgage that was taken out on this home.
Original Mortgage
$90,000
Interest Rate
6.99%
Mortgage Type
Purchase Money Mortgage
Purchase Details
Closed on
May 4, 1992
Sold by
Gilligan Louise A
Bought by
Rocheleau Daniel P
Create a Home Valuation Report for This Property
The Home Valuation Report is an in-depth analysis detailing your home's value as well as a comparison with similar homes in the area
Home Values in the Area
Average Home Value in this Area
Purchase History
| Date | Buyer | Sale Price | Title Company |
|---|---|---|---|
| Kallio Kyle S | $135,000 | -- | |
| Kallio Kyle S | $135,000 | -- | |
| Driscoll Timothy | $102,000 | -- | |
| Driscoll Timothy | $102,000 | -- | |
| Rocheleau Daniel P | $65,000 | -- | |
| Rocheleau Daniel P | $65,000 | -- |
Source: Public Records
Mortgage History
| Date | Status | Borrower | Loan Amount |
|---|---|---|---|
| Open | Rocheleau Daniel P | $126,875 | |
| Closed | Rocheleau Daniel P | $126,875 | |
| Previous Owner | Rocheleau Daniel P | $90,000 |
Source: Public Records
Tax History Compared to Growth
Tax History
| Year | Tax Paid | Tax Assessment Tax Assessment Total Assessment is a certain percentage of the fair market value that is determined by local assessors to be the total taxable value of land and additions on the property. | Land | Improvement |
|---|---|---|---|---|
| 2025 | $3,722 | $250,300 | $31,100 | $219,200 |
| 2024 | $3,632 | $230,600 | $31,100 | $199,500 |
| 2023 | $3,643 | $220,100 | $31,100 | $189,000 |
| 2022 | $3,525 | $186,700 | $30,400 | $156,300 |
| 2021 | $3,407 | $165,800 | $30,400 | $135,400 |
| 2020 | $3,333 | $165,800 | $30,400 | $135,400 |
| 2019 | $2,943 | $130,500 | $30,400 | $100,100 |
| 2018 | $2,859 | $122,200 | $29,000 | $93,200 |
| 2017 | $2,933 | $127,700 | $35,400 | $92,300 |
| 2016 | $2,814 | $123,700 | $34,700 | $89,000 |
| 2015 | $2,894 | $129,900 | $34,700 | $95,200 |
Source: Public Records
Map
Nearby Homes
- 9 Willard Rd
- 18 Corey Hill Rd
- 30 Russell Hill Rd
- 136 Willard Rd
- 101 Russell Hill Rd
- 152 Ashby Rd
- 189 Fitchburg Rd
- 179 Cashman Hill Rd
- Lot 40C Winchendon Rd
- 134 Stodge Meadow Rd
- 40 Hunter Ave
- Lot 3 W State Rd
- 66 S Main St
- 0 Holt Rd
- 15 Kirali Ct
- 6 Wyman Rd
- 0 Rindge Turnpike
- 84 Murray Rd
- 358 Winchendon Rd
- 13 Browns Lake Rd