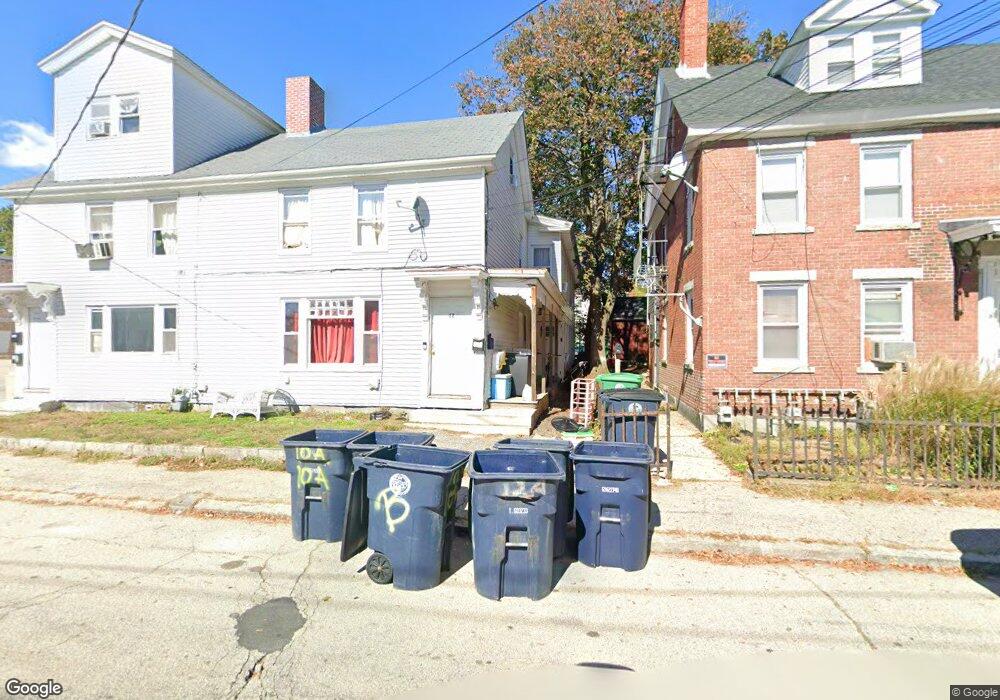
12 Lock St Nashua, NH 03064
North End Nashua NeighborhoodEstimated Value: $412,816 - $589,000
5
Beds
2
Baths
4,541
Sq Ft
$114/Sq Ft
Est. Value
About This Home
This home is located at 12 Lock St, Nashua, NH 03064 and is currently estimated at $517,704, approximately $114 per square foot. 12 Lock St is a home located in Hillsborough County with nearby schools including Mount Pleasant Elementary School, Pennichuck Middle School, and Nashua High School North.
Ownership History
Date
Name
Owned For
Owner Type
Purchase Details
Closed on
May 10, 2018
Sold by
Donald E Johansen Ret and Roberts
Bought by
Rj Real Estate Llc
Current Estimated Value
Purchase Details
Closed on
May 18, 2017
Sold by
North Coast Financial
Bought by
Bd 10-12 Lock St Realt
Home Financials for this Owner
Home Financials are based on the most recent Mortgage that was taken out on this home.
Original Mortgage
$220,500
Interest Rate
4.1%
Mortgage Type
New Conventional
Purchase Details
Closed on
Feb 11, 2016
Sold by
Citimortgage Inc
Bought by
North Coast Financial
Purchase Details
Closed on
Aug 7, 2015
Sold by
Villers Ernie and Citimortgage Inc
Bought by
Citimortgage Inc
Purchase Details
Closed on
Jan 4, 2005
Sold by
Gorveatt Floyd W
Bought by
Villers Ernie
Home Financials for this Owner
Home Financials are based on the most recent Mortgage that was taken out on this home.
Original Mortgage
$319,978
Interest Rate
5.73%
Mortgage Type
Purchase Money Mortgage
Create a Home Valuation Report for This Property
The Home Valuation Report is an in-depth analysis detailing your home's value as well as a comparison with similar homes in the area
Home Values in the Area
Average Home Value in this Area
Purchase History
| Date | Buyer | Sale Price | Title Company |
|---|---|---|---|
| Rj Real Estate Llc | -- | -- | |
| Bd 10-12 Lock St Realt | $294,000 | -- | |
| North Coast Financial | $177,933 | -- | |
| Citimortgage Inc | $218,500 | -- | |
| Villers Ernie | $325,000 | -- |
Source: Public Records
Mortgage History
| Date | Status | Borrower | Loan Amount |
|---|---|---|---|
| Previous Owner | Bd 10-12 Lock St Realt | $220,500 | |
| Previous Owner | Villers Ernie | $319,978 |
Source: Public Records
Tax History Compared to Growth
Tax History
| Year | Tax Paid | Tax Assessment Tax Assessment Total Assessment is a certain percentage of the fair market value that is determined by local assessors to be the total taxable value of land and additions on the property. | Land | Improvement |
|---|---|---|---|---|
| 2024 | $6,025 | $378,900 | $96,200 | $282,700 |
| 2023 | $5,861 | $321,500 | $76,900 | $244,600 |
| 2022 | $5,810 | $321,500 | $76,900 | $244,600 |
| 2021 | $3,680 | $158,500 | $51,300 | $107,200 |
| 2020 | $3,584 | $158,500 | $51,300 | $107,200 |
| 2019 | $3,449 | $158,500 | $51,300 | $107,200 |
| 2018 | $3,998 | $158,500 | $51,300 | $107,200 |
| 2017 | $3,943 | $152,900 | $72,800 | $80,100 |
| 2016 | $3,833 | $152,900 | $72,800 | $80,100 |
| 2015 | $3,751 | $152,900 | $72,800 | $80,100 |
| 2014 | $3,677 | $152,900 | $72,800 | $80,100 |
Source: Public Records
Map
Nearby Homes
- 11 Charles St
- 36-38 Courtland St
- 71 Concord St
- 38 Central St
- 13 Sapphire Ln
- 15 Atherton Ave
- 19 Atherton Ave
- 0 Baldwin St
- 4 Reservoir St
- 5 Mulberry St
- 61 Manchester St
- 30 Ledge St
- 18 Harbor Ave Unit 208
- 7 Bitirnas St Unit U7
- 8 Buck St Unit 10
- 24 E Otterson St
- 13 Mulvanity St
- 21 Edson St
- 31 Juliana Ave
- 31 Juliana Ave Unit 4
- 10 Lock St
- 14 Lock St Unit 16
- 14-16 Lock St
- 9 Lock St Unit 11
- 32 Orange St
- 57 Lock St
- 13 Lock St Unit AC
- 13 Lock St Unit B
- 24 Orange St Unit 26
- 30 Lowell St
- 30 Lowell St Unit 1L
- 30 Lowell St Unit 2
- 30 Lowell St Unit B
- 30 Lowell St Unit 4
- 28 Lowell St
- 1 Lock St Unit 1-A
- 32 Lowell St
- 34 Orange St
- 33 Orange St
- 33 Orange St Unit B