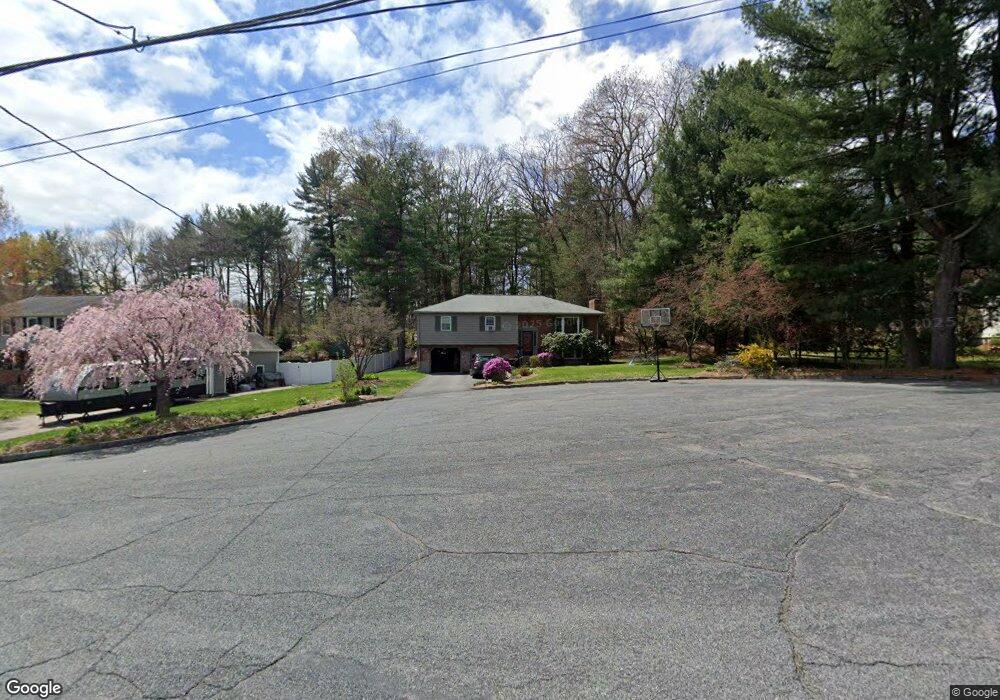
12 Lowry Rd Framingham, MA 01701
Saxonville NeighborhoodEstimated Value: $687,000 - $752,000
3
Beds
2
Baths
1,678
Sq Ft
$429/Sq Ft
Est. Value
About This Home
This home is located at 12 Lowry Rd, Framingham, MA 01701 and is currently estimated at $720,194, approximately $429 per square foot. 12 Lowry Rd is a home located in Middlesex County with nearby schools including Framingham High School and MetroWest Jewish Day School.
Ownership History
Date
Name
Owned For
Owner Type
Purchase Details
Closed on
May 4, 2009
Sold by
Johnson Timothy and Johnson Silvia S
Bought by
Moquin Nathan and Moquin Emily
Current Estimated Value
Home Financials for this Owner
Home Financials are based on the most recent Mortgage that was taken out on this home.
Original Mortgage
$342,678
Outstanding Balance
$216,628
Interest Rate
4.86%
Mortgage Type
Purchase Money Mortgage
Estimated Equity
$503,566
Purchase Details
Closed on
Nov 14, 2002
Sold by
Johnson Silvia S and Sedo Natalia
Bought by
Johnson Timothy and Johnson Silvia S
Home Financials for this Owner
Home Financials are based on the most recent Mortgage that was taken out on this home.
Original Mortgage
$280,000
Interest Rate
6.03%
Mortgage Type
Purchase Money Mortgage
Purchase Details
Closed on
Jun 23, 2000
Sold by
Ramaswami Aparna and Ramaswami Karthik
Bought by
Sedo Silvia S and Sedo Natalia
Purchase Details
Closed on
Nov 25, 1992
Sold by
Haugen Peter K and Haugen Loretta S
Bought by
Ramaswami Aparna and Ramaswami Karthik
Create a Home Valuation Report for This Property
The Home Valuation Report is an in-depth analysis detailing your home's value as well as a comparison with similar homes in the area
Home Values in the Area
Average Home Value in this Area
Purchase History
| Date | Buyer | Sale Price | Title Company |
|---|---|---|---|
| Moquin Nathan | $349,000 | -- | |
| Moquin Nathan | $349,000 | -- | |
| Johnson Timothy | $60,000 | -- | |
| Johnson Timothy | $60,000 | -- | |
| Sedo Silvia S | $295,000 | -- | |
| Ramaswami Aparna | $196,000 | -- | |
| Ramaswami Aparna | $196,000 | -- |
Source: Public Records
Mortgage History
| Date | Status | Borrower | Loan Amount |
|---|---|---|---|
| Open | Moquin Nathan | $342,678 | |
| Closed | Ramaswami Aparna | $342,678 | |
| Previous Owner | Johnson Timothy | $280,000 |
Source: Public Records
Tax History
| Year | Tax Paid | Tax Assessment Tax Assessment Total Assessment is a certain percentage of the fair market value that is determined by local assessors to be the total taxable value of land and additions on the property. | Land | Improvement |
|---|---|---|---|---|
| 2025 | $8,099 | $678,300 | $271,300 | $407,000 |
| 2024 | $7,386 | $592,800 | $242,300 | $350,500 |
| 2023 | $6,955 | $531,300 | $216,300 | $315,000 |
| 2022 | $6,592 | $479,800 | $196,300 | $283,500 |
| 2021 | $6,456 | $459,500 | $188,700 | $270,800 |
| 2020 | $6,486 | $433,000 | $171,400 | $261,600 |
| 2019 | $6,523 | $424,100 | $171,400 | $252,700 |
| 2018 | $6,495 | $398,000 | $165,000 | $233,000 |
| 2017 | $6,375 | $381,500 | $160,200 | $221,300 |
| 2016 | $6,239 | $359,000 | $160,200 | $198,800 |
| 2015 | $6,176 | $346,600 | $160,700 | $185,900 |
Source: Public Records
Map
Nearby Homes
- 21 Potter Rd
- 226 Stonebridge Rd
- 63 Landham Rd
- 38 Bradford Rd
- 34 Christopher Ln
- 0 Wagonwheel Rd
- 33 Oak Hill Rd
- 87 Landham Rd
- 11 Edith Rd
- 472 Potter Rd
- 4 Tartufi Cir
- 19 Park Ave
- 10 Brookside Farm Ln
- 18 Jay Dr
- 18 Brigati Terrace
- 189 Danforth St
- 16 Castle Rd
- 10 Rolling Ln
- 216 Landham Rd
- 11 Danforth Park Rd
Your Personal Tour Guide
Ask me questions while you tour the home.