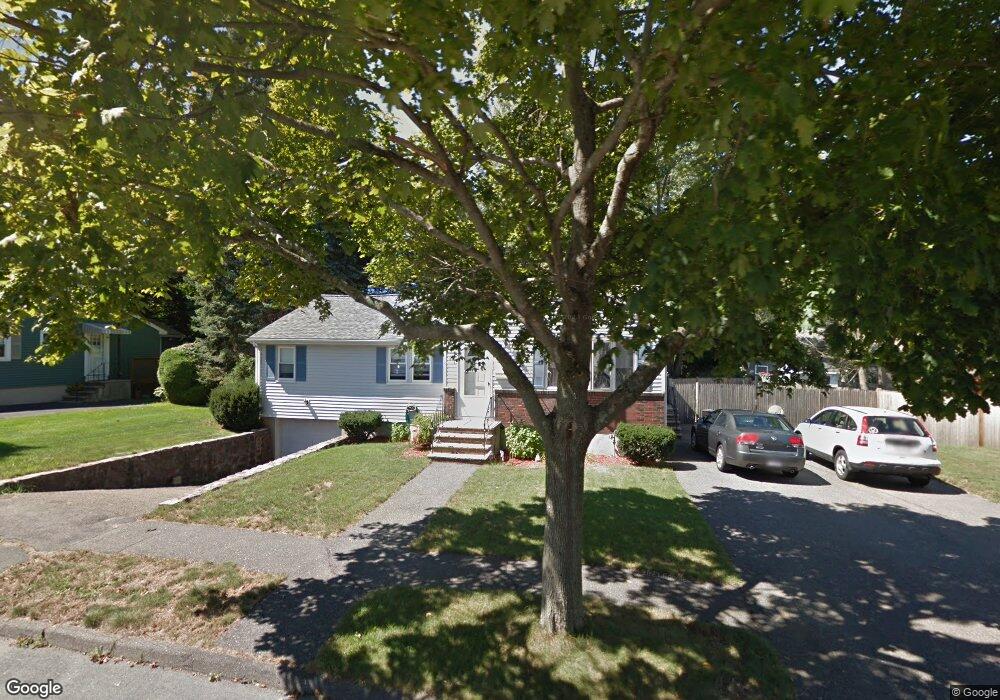
12 Lynch St Peabody, MA 01960
South Peabody NeighborhoodEstimated Value: $636,000 - $730,000
3
Beds
2
Baths
1,241
Sq Ft
$539/Sq Ft
Est. Value
About This Home
This home is located at 12 Lynch St, Peabody, MA 01960 and is currently estimated at $669,101, approximately $539 per square foot. 12 Lynch St is a home located in Essex County with nearby schools including Peabody Veterans Memorial High School and Our Lady Of Assumption School.
Ownership History
Date
Name
Owned For
Owner Type
Purchase Details
Closed on
Aug 1, 2008
Sold by
Jacob J Savy T and Savy Jacob J
Bought by
Mirabello Daniel and Mirabello Daniel C
Current Estimated Value
Home Financials for this Owner
Home Financials are based on the most recent Mortgage that was taken out on this home.
Original Mortgage
$295,365
Interest Rate
6.47%
Mortgage Type
Purchase Money Mortgage
Purchase Details
Closed on
Jul 17, 2008
Sold by
Savy Jacob J
Bought by
Savy Tr Jacob J
Home Financials for this Owner
Home Financials are based on the most recent Mortgage that was taken out on this home.
Original Mortgage
$295,365
Interest Rate
6.47%
Mortgage Type
Purchase Money Mortgage
Create a Home Valuation Report for This Property
The Home Valuation Report is an in-depth analysis detailing your home's value as well as a comparison with similar homes in the area
Home Values in the Area
Average Home Value in this Area
Purchase History
| Date | Buyer | Sale Price | Title Company |
|---|---|---|---|
| Mirabello Daniel | $300,000 | -- | |
| Savy Tr Jacob J | -- | -- |
Source: Public Records
Mortgage History
| Date | Status | Borrower | Loan Amount |
|---|---|---|---|
| Open | Savy Tr Jacob J | $303,682 | |
| Closed | Savy Tr Jacob J | $299,795 | |
| Closed | Savy Tr Jacob J | $295,365 |
Source: Public Records
Tax History
| Year | Tax Paid | Tax Assessment Tax Assessment Total Assessment is a certain percentage of the fair market value that is determined by local assessors to be the total taxable value of land and additions on the property. | Land | Improvement |
|---|---|---|---|---|
| 2025 | $5,166 | $557,900 | $243,100 | $314,800 |
| 2024 | $4,848 | $531,600 | $243,100 | $288,500 |
| 2023 | $4,906 | $515,300 | $217,100 | $298,200 |
| 2022 | $4,585 | $454,000 | $193,900 | $260,100 |
| 2021 | $4,354 | $415,100 | $176,200 | $238,900 |
| 2020 | $4,230 | $393,900 | $176,200 | $217,700 |
| 2019 | $4,272 | $388,000 | $176,200 | $211,800 |
| 2018 | $4,155 | $362,600 | $160,200 | $202,400 |
| 2017 | $3,702 | $314,800 | $160,200 | $154,600 |
| 2016 | $3,755 | $315,000 | $160,200 | $154,800 |
| 2015 | $3,644 | $296,300 | $156,200 | $140,100 |
Source: Public Records
Map
Nearby Homes
- 12 Mansfield St
- 13 Ralph Rd
- 15 York Terrace
- 233 Bartholomew St
- 60r Lynnbrook Rd
- 37 Locust St
- 21 Oak Leaf Way
- 325 Den Quarry Rd
- 11 Pulver Dr
- 55 Apple Blossom Ln Unit 8
- 32 Grant Rd
- 217 Cedar Brook Rd
- 11 Emerald Dr
- 115 Quinn Rd
- 54 Harris Rd
- 2 Anchor Rd
- 26 Joel Cir
- 9 Hermon Rd
- 741 Salem St
- 111 Den Quarry Rd
Your Personal Tour Guide
Ask me questions while you tour the home.