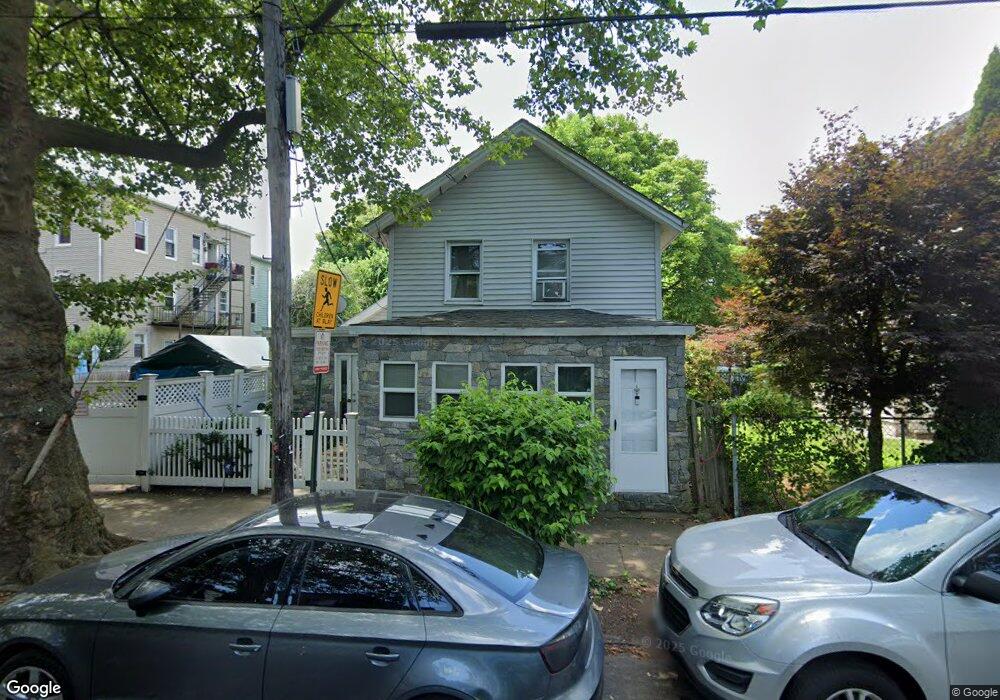
12 Main St New Haven, CT 06513
Fair Haven NeighborhoodEstimated Value: $292,000 - $365,000
4
Beds
2
Baths
1,718
Sq Ft
$191/Sq Ft
Est. Value
About This Home
This home is located at 12 Main St, New Haven, CT 06513 and is currently estimated at $328,184, approximately $191 per square foot. 12 Main St is a home located in New Haven County with nearby schools including Clinton Avenue School, Elm City College Preparatory School, and Cold Spring School.
Ownership History
Date
Name
Owned For
Owner Type
Purchase Details
Closed on
Jul 28, 2022
Sold by
Koen-Young Robert
Bought by
Jones-Young Shelley
Current Estimated Value
Purchase Details
Closed on
Sep 11, 1998
Sold by
Colon Aida and Colon Felix M
Bought by
Koen-Young Robert
Home Financials for this Owner
Home Financials are based on the most recent Mortgage that was taken out on this home.
Original Mortgage
$33,700
Interest Rate
6.92%
Create a Home Valuation Report for This Property
The Home Valuation Report is an in-depth analysis detailing your home's value as well as a comparison with similar homes in the area
Home Values in the Area
Average Home Value in this Area
Purchase History
| Date | Buyer | Sale Price | Title Company |
|---|---|---|---|
| Jones-Young Shelley | -- | None Available | |
| Koen-Young Robert | $35,560 | -- |
Source: Public Records
Mortgage History
| Date | Status | Borrower | Loan Amount |
|---|---|---|---|
| Previous Owner | Koen-Young Robert | $125,000 | |
| Previous Owner | Koen-Young Robert | $74,000 | |
| Previous Owner | Koen-Young Robert | $33,700 |
Source: Public Records
Tax History Compared to Growth
Tax History
| Year | Tax Paid | Tax Assessment Tax Assessment Total Assessment is a certain percentage of the fair market value that is determined by local assessors to be the total taxable value of land and additions on the property. | Land | Improvement |
|---|---|---|---|---|
| 2025 | $6,346 | $161,070 | $27,860 | $133,210 |
| 2024 | $6,201 | $161,070 | $27,860 | $133,210 |
| 2023 | $5,992 | $161,070 | $27,860 | $133,210 |
| 2022 | $6,403 | $161,070 | $27,860 | $133,210 |
| 2021 | $4,211 | $95,970 | $22,330 | $73,640 |
| 2020 | $4,211 | $95,970 | $22,330 | $73,640 |
| 2019 | $4,125 | $95,970 | $22,330 | $73,640 |
| 2018 | $4,125 | $95,970 | $22,330 | $73,640 |
| 2017 | $3,712 | $95,970 | $22,330 | $73,640 |
| 2016 | $3,609 | $86,870 | $14,910 | $71,960 |
| 2015 | $3,609 | $86,870 | $14,910 | $71,960 |
| 2014 | $3,609 | $86,870 | $14,910 | $71,960 |
Source: Public Records
Map
Nearby Homes