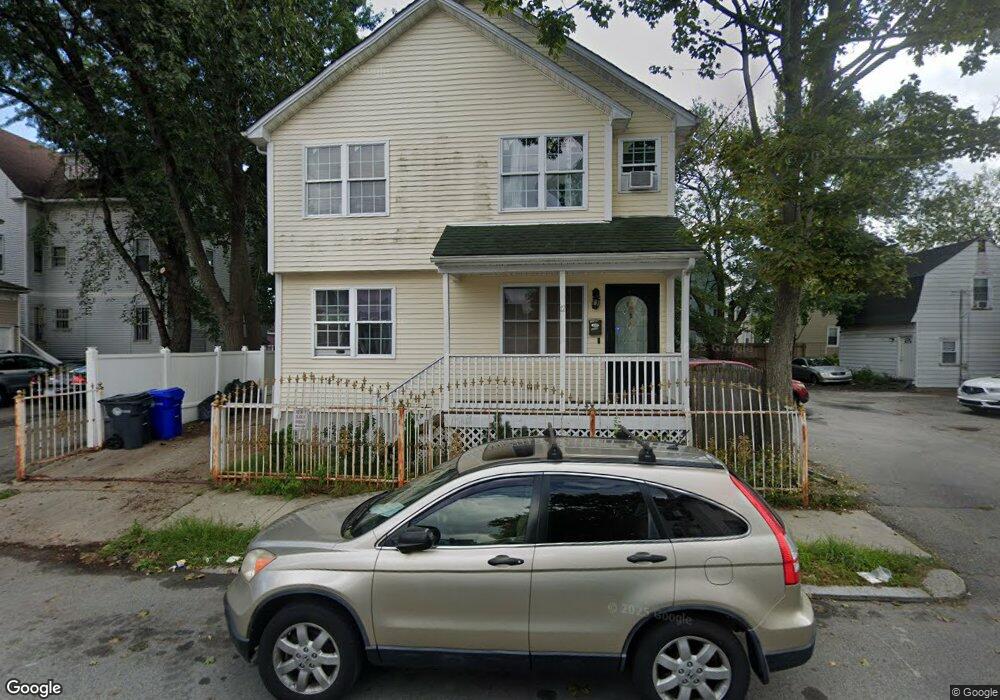
12 Marion Ave N Providence, RI 02905
Washington Park NeighborhoodEstimated Value: $435,000 - $530,545
4
Beds
2
Baths
3,125
Sq Ft
$153/Sq Ft
Est. Value
About This Home
This home is located at 12 Marion Ave N, Providence, RI 02905 and is currently estimated at $478,386, approximately $153 per square foot. 12 Marion Ave N is a home located in Providence County with nearby schools including Highlander Charter School and Saint Paul School.
Ownership History
Date
Name
Owned For
Owner Type
Purchase Details
Closed on
May 15, 2020
Sold by
Bourdier Erwin and Bourdier Lissette
Bought by
Brito Clonice M and Torres Aneudy
Current Estimated Value
Home Financials for this Owner
Home Financials are based on the most recent Mortgage that was taken out on this home.
Original Mortgage
$255,290
Outstanding Balance
$225,646
Interest Rate
3.62%
Mortgage Type
FHA
Estimated Equity
$252,740
Purchase Details
Closed on
Nov 13, 2008
Sold by
Alvarez George J and Alvarez Glicelda
Bought by
Bourdier Lissette and Bourdier Erwin
Home Financials for this Owner
Home Financials are based on the most recent Mortgage that was taken out on this home.
Original Mortgage
$156,929
Interest Rate
6.13%
Mortgage Type
Purchase Money Mortgage
Purchase Details
Closed on
Apr 18, 2005
Sold by
Lopez Mercedes
Bought by
Santana Luis
Create a Home Valuation Report for This Property
The Home Valuation Report is an in-depth analysis detailing your home's value as well as a comparison with similar homes in the area
Home Values in the Area
Average Home Value in this Area
Purchase History
| Date | Buyer | Sale Price | Title Company |
|---|---|---|---|
| Brito Clonice M | $260,000 | None Available | |
| Bourdier Lissette | $159,000 | -- | |
| Santana Luis | $56,000 | -- |
Source: Public Records
Mortgage History
| Date | Status | Borrower | Loan Amount |
|---|---|---|---|
| Open | Brito Clonice M | $255,290 | |
| Previous Owner | Santana Luis | $156,929 | |
| Previous Owner | Santana Luis | $222,920 |
Source: Public Records
Tax History
| Year | Tax Paid | Tax Assessment Tax Assessment Total Assessment is a certain percentage of the fair market value that is determined by local assessors to be the total taxable value of land and additions on the property. | Land | Improvement |
|---|---|---|---|---|
| 2025 | $3,535 | $420,800 | $118,800 | $302,000 |
| 2024 | $6,905 | $376,300 | $75,300 | $301,000 |
| 2023 | $6,905 | $376,300 | $75,300 | $301,000 |
| 2022 | $6,698 | $376,300 | $75,300 | $301,000 |
| 2021 | $6,442 | $262,300 | $33,200 | $229,100 |
| 2020 | $6,442 | $262,300 | $33,200 | $229,100 |
| 2019 | $6,442 | $262,300 | $33,200 | $229,100 |
| 2018 | $4,692 | $146,800 | $30,200 | $116,600 |
| 2017 | $4,692 | $146,800 | $30,200 | $116,600 |
| 2016 | $4,692 | $146,800 | $30,200 | $116,600 |
| 2015 | $4,750 | $143,500 | $30,200 | $113,300 |
| 2014 | $4,843 | $143,500 | $30,200 | $113,300 |
| 2013 | $4,843 | $143,500 | $30,200 | $113,300 |
Source: Public Records
Map
Nearby Homes
- 12 Payton St
- 55 Homer St
- 61 Cyr St
- 297 Vermont Ave
- 374 New York Ave
- 286 California Ave
- 52 Cactus St
- 255 Ohio Ave
- 273 Montgomery Ave
- 274 Montgomery Ave
- 233 California Ave
- 139 Babcock St
- 358 Northup St
- 325 Northup St
- 162 Verndale Ave
- 183 Baker St
- 160 Ohio Ave
- 175 Montgomery Ave
- 147 Wentworth Ave
- 166 Narragansett St
- 12 Marion Ave N
- 1445 Broad St
- 1451 Broad St
- 18 Marion Ave N
- 17 Farragut Ave
- 7 Farragut Ave
- 20 Marion Ave N
- 15 Marion Ave N
- 15 Marion Ave N
- 13 Farragut St
- 21 Farragut Ave
- 1453 Broad St
- 19 Marion Ave N
- 19 Marion Ave N
- 26 Marion Ave N
- 19 Marion Ave N
- 19 Marion Ave N Unit 3
- 1455 Broad St
- 1431 Broad St
- 25 Marion Ave N
Your Personal Tour Guide
Ask me questions while you tour the home.