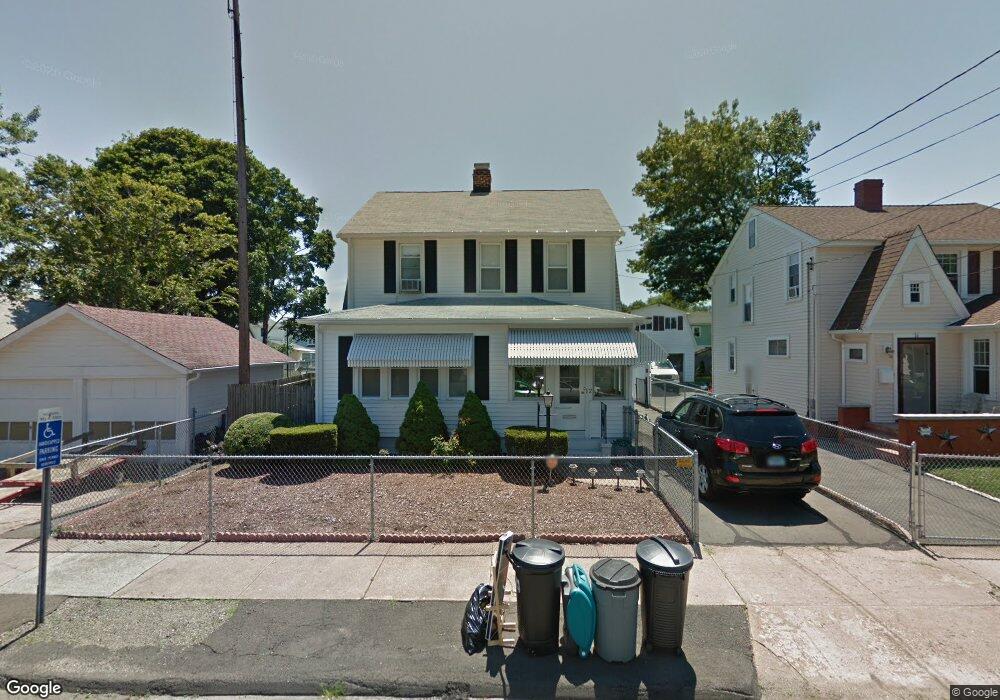
12 Marion St West Haven, CT 06516
West Haven Center NeighborhoodEstimated Value: $354,827 - $384,000
3
Beds
2
Baths
1,720
Sq Ft
$214/Sq Ft
Est. Value
About This Home
This home is located at 12 Marion St, West Haven, CT 06516 and is currently estimated at $367,957, approximately $213 per square foot. 12 Marion St is a home located in New Haven County with nearby schools including Carrigan 5/6 Intermediate School, Harry M. Bailey Middle School, and West Haven High School.
Ownership History
Date
Name
Owned For
Owner Type
Purchase Details
Closed on
Jun 6, 2014
Sold by
Simone Rosemarie A
Bought by
Simone Michele
Current Estimated Value
Purchase Details
Closed on
Mar 29, 1993
Sold by
Berardesca Matthew and Berardesca Elaine
Bought by
Simone Joseph V and Simone Rose Marie
Create a Home Valuation Report for This Property
The Home Valuation Report is an in-depth analysis detailing your home's value as well as a comparison with similar homes in the area
Home Values in the Area
Average Home Value in this Area
Purchase History
| Date | Buyer | Sale Price | Title Company |
|---|---|---|---|
| Simone Michele | -- | -- | |
| Simone Joseph V | $110,500 | -- | |
| Simone Michele | -- | -- | |
| Simone Joseph V | $110,500 | -- |
Source: Public Records
Mortgage History
| Date | Status | Borrower | Loan Amount |
|---|---|---|---|
| Previous Owner | Simone Joseph V | $42,200 | |
| Previous Owner | Simone Joseph V | $133,050 | |
| Previous Owner | Simone Joseph V | $79,112 |
Source: Public Records
Tax History Compared to Growth
Tax History
| Year | Tax Paid | Tax Assessment Tax Assessment Total Assessment is a certain percentage of the fair market value that is determined by local assessors to be the total taxable value of land and additions on the property. | Land | Improvement |
|---|---|---|---|---|
| 2025 | $7,317 | $211,890 | $58,800 | $153,090 |
| 2024 | $6,844 | $141,050 | $40,740 | $100,310 |
| 2023 | $6,560 | $141,050 | $40,740 | $100,310 |
| 2022 | $6,432 | $141,050 | $40,740 | $100,310 |
| 2021 | $6,432 | $141,050 | $40,740 | $100,310 |
| 2020 | $6,229 | $123,410 | $32,760 | $90,650 |
| 2019 | $6,006 | $123,410 | $32,760 | $90,650 |
| 2018 | $5,796 | $120,120 | $32,760 | $87,360 |
| 2017 | $5,485 | $120,120 | $32,760 | $87,360 |
| 2016 | $5,473 | $120,120 | $32,760 | $87,360 |
| 2015 | $5,172 | $128,170 | $36,540 | $91,630 |
| 2014 | $5,140 | $128,170 | $36,540 | $91,630 |
Source: Public Records
Map
Nearby Homes