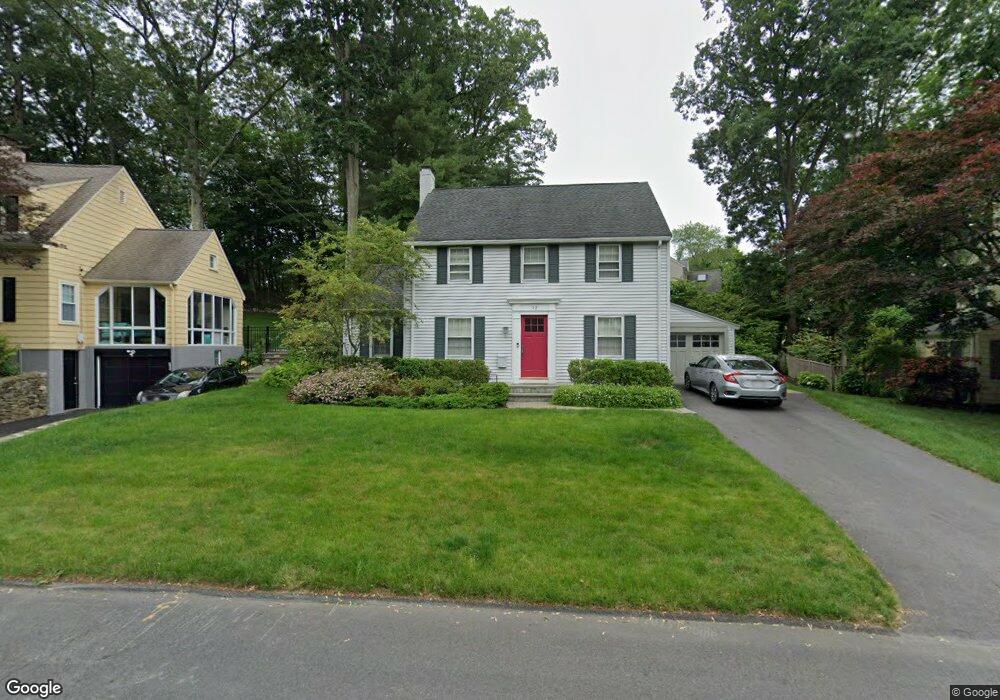
12 Martin Rd Wellesley Hills, MA 02481
Estimated Value: $1,118,000 - $1,381,000
3
Beds
2
Baths
1,515
Sq Ft
$838/Sq Ft
Est. Value
About This Home
This home is located at 12 Martin Rd, Wellesley Hills, MA 02481 and is currently estimated at $1,269,160, approximately $837 per square foot. 12 Martin Rd is a home located in Norfolk County with nearby schools including Katharine Lee Bates Elementary School, Wellesley Middle School, and Wellesley Sr High School.
Ownership History
Date
Name
Owned For
Owner Type
Purchase Details
Closed on
Oct 30, 1997
Sold by
Vahey Edward
Bought by
Kiernan Michael and Kiernan Sharon R
Current Estimated Value
Purchase Details
Closed on
May 31, 1991
Sold by
1982 Re T
Bought by
Vahey Sandra E and Edward F Vahey
Create a Home Valuation Report for This Property
The Home Valuation Report is an in-depth analysis detailing your home's value as well as a comparison with similar homes in the area
Home Values in the Area
Average Home Value in this Area
Purchase History
| Date | Buyer | Sale Price | Title Company |
|---|---|---|---|
| Kiernan Michael | $301,400 | -- | |
| Vahey Sandra E | $222,500 | -- |
Source: Public Records
Mortgage History
| Date | Status | Borrower | Loan Amount |
|---|---|---|---|
| Open | Vahey Sandra E | $100,000 | |
| Closed | Vahey Sandra E | $140,000 | |
| Open | Vahey Sandra E | $227,150 |
Source: Public Records
Tax History Compared to Growth
Tax History
| Year | Tax Paid | Tax Assessment Tax Assessment Total Assessment is a certain percentage of the fair market value that is determined by local assessors to be the total taxable value of land and additions on the property. | Land | Improvement |
|---|---|---|---|---|
| 2025 | $12,665 | $1,232,000 | $922,000 | $310,000 |
| 2024 | $11,493 | $1,104,000 | $802,000 | $302,000 |
| 2023 | $10,122 | $884,000 | $681,000 | $203,000 |
| 2022 | $9,122 | $781,000 | $583,000 | $198,000 |
| 2021 | $9,177 | $781,000 | $583,000 | $198,000 |
| 2020 | $9,028 | $781,000 | $583,000 | $198,000 |
| 2019 | $9,036 | $781,000 | $583,000 | $198,000 |
| 2018 | $8,222 | $688,000 | $561,000 | $127,000 |
| 2017 | $8,112 | $688,000 | $561,000 | $127,000 |
| 2016 | $7,973 | $674,000 | $551,000 | $123,000 |
| 2015 | $7,757 | $671,000 | $534,000 | $137,000 |
Source: Public Records
Map
Nearby Homes
- 6 Wilde Rd
- 23 Pilgrim Rd
- 12 Russell Rd Unit 405
- 365 Weston Rd
- 13 Cavanaugh Rd
- 6 Norwich Rd
- 18 Patton Rd
- 51 Boulder Brook Rd
- 209 Bristol Rd
- 428 Weston Rd
- 36 Oakridge Rd
- 19 Louis Dr
- 63 Oak St Unit B
- 6 Nantucket Rd
- 16 Stearns Rd Unit 101
- 16 Stearns Rd Unit 302
- 16 Stearns Rd Unit 207
- 16 Stearns Rd Unit 301
- 16 Stearns Rd Unit 103
- 16 Stearns Rd Unit 202