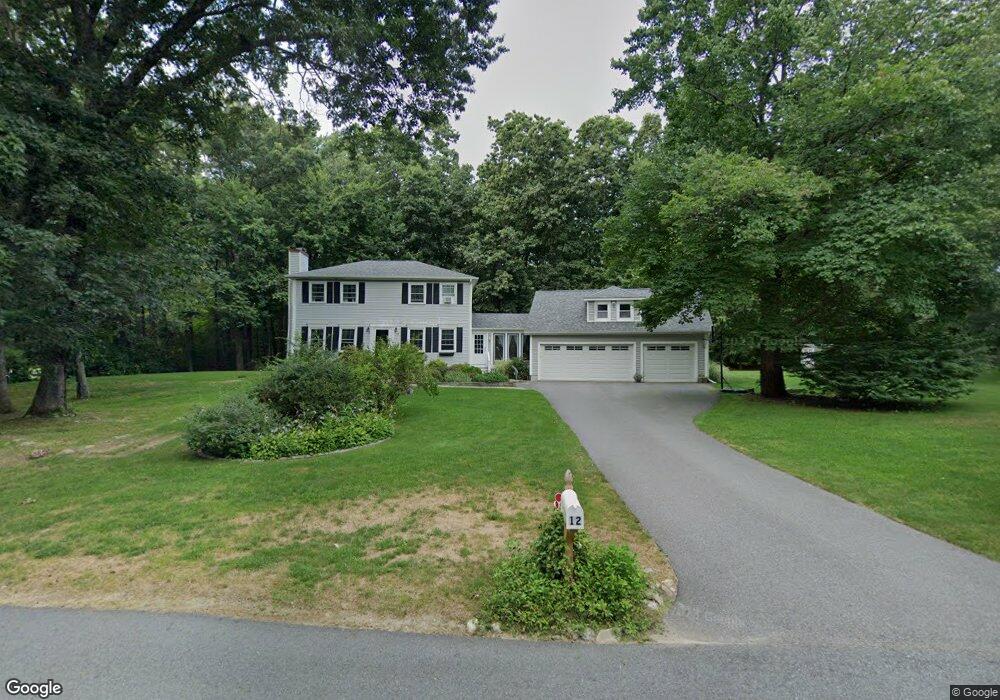
12 Meadow Ln Salem, NH 03079
Salem Center NeighborhoodEstimated Value: $696,000 - $793,000
3
Beds
2
Baths
1,982
Sq Ft
$377/Sq Ft
Est. Value
About This Home
This home is located at 12 Meadow Ln, Salem, NH 03079 and is currently estimated at $747,228, approximately $377 per square foot. 12 Meadow Ln is a home located in Rockingham County with nearby schools including William T. Barron Elementary School, Woodbury School, and Salem High School.
Ownership History
Date
Name
Owned For
Owner Type
Purchase Details
Closed on
Feb 26, 2018
Sold by
Desjardins Ronald J and Desjardins Pamela J
Bought by
Desjardins Ret
Current Estimated Value
Purchase Details
Closed on
Apr 30, 1998
Sold by
Parisi Joseph S and Parisi Bonnie L
Bought by
Desjardins Ronald J and Desjardins Pamela J
Home Financials for this Owner
Home Financials are based on the most recent Mortgage that was taken out on this home.
Original Mortgage
$165,300
Interest Rate
7.04%
Create a Home Valuation Report for This Property
The Home Valuation Report is an in-depth analysis detailing your home's value as well as a comparison with similar homes in the area
Home Values in the Area
Average Home Value in this Area
Purchase History
| Date | Buyer | Sale Price | Title Company |
|---|---|---|---|
| Desjardins Ret | -- | -- | |
| Desjardins Ronald J | $174,000 | -- |
Source: Public Records
Mortgage History
| Date | Status | Borrower | Loan Amount |
|---|---|---|---|
| Previous Owner | Desjardins Ronald J | $226,000 | |
| Previous Owner | Desjardins Ronald J | $235,000 | |
| Previous Owner | Desjardins Ronald J | $100,000 | |
| Previous Owner | Desjardins Ronald J | $165,300 |
Source: Public Records
Tax History Compared to Growth
Tax History
| Year | Tax Paid | Tax Assessment Tax Assessment Total Assessment is a certain percentage of the fair market value that is determined by local assessors to be the total taxable value of land and additions on the property. | Land | Improvement |
|---|---|---|---|---|
| 2024 | $9,743 | $553,600 | $209,900 | $343,700 |
| 2023 | $9,389 | $553,600 | $209,900 | $343,700 |
| 2022 | $8,885 | $553,600 | $209,900 | $343,700 |
| 2021 | $8,847 | $553,600 | $209,900 | $343,700 |
| 2020 | $8,198 | $372,300 | $150,000 | $222,300 |
| 2019 | $8,183 | $372,300 | $150,000 | $222,300 |
| 2018 | $8,045 | $372,300 | $150,000 | $222,300 |
| 2017 | $7,759 | $372,300 | $150,000 | $222,300 |
| 2016 | $7,606 | $372,300 | $150,000 | $222,300 |
| 2015 | $6,950 | $324,900 | $148,000 | $176,900 |
| 2014 | $6,755 | $324,900 | $148,000 | $176,900 |
| 2013 | $6,647 | $324,900 | $148,000 | $176,900 |
Source: Public Records
Map
Nearby Homes
- 1 Ballard Ln
- 1 Kimball Ave
- 40 Stanwood Rd Unit 9
- 20 Stanwood Rd
- 6 Douglas Dr
- 27 General Pulaski Dr
- 17 Sawmill Ridge Rd
- 74 Ayers Village Rd
- 1513 Broadway
- 8 Stoneybrook Ln
- 51 Bluff St
- 139 North St
- 55A Millville Cir
- 1 Longview Dr Unit 110
- 1 Longview Dr Unit 203
- 1 Longview Dr Unit 101
- 1 Longview Dr Unit 108
- 1 Longview Dr Unit 301
- 1 Longview Dr Unit 401
- 1 Longview Dr Unit 306
- 6 Meadow Ln
- 9 Meadow Ln
- 14 Meadow Ln
- 7 Meadow Ln
- 37 Hampstead Rd
- 5 Meadow Ln
- 5 Meadow Ln Unit 5 Meadow
- 35 Hampstead Rd
- 33 Hampstead Rd
- 13 Meadow Ln
- 1 Meadow Ln
- 16 Meadow Ln
- 1 & 3 Meadow Ln
- 22 Ganley Dr
- 17A Hampstead Rd
- 25 Hampstead Rd
- 28 Hampstead Rd
- 17 Hampstead Rd
- 17 Hampstead Rd
- 14 Lincoln Terrace