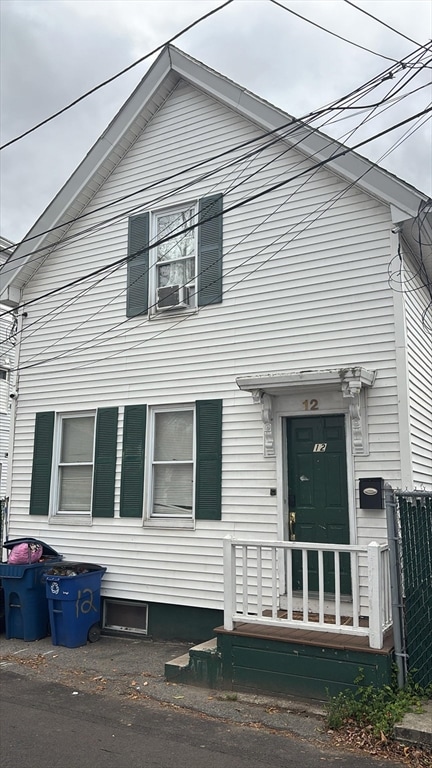
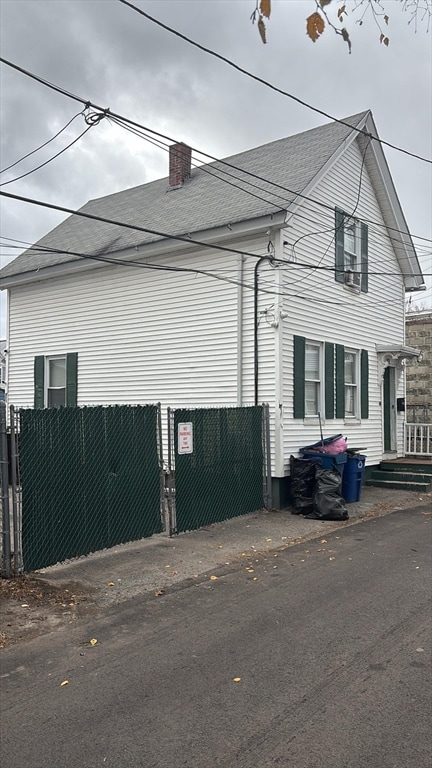
12 Merrimack View Ct Lawrence, MA 01841
Tower Hill NeighborhoodEstimated payment $2,422/month
Highlights
- Granite Flooring
- Property is near public transit
- No HOA
- Covered Deck
- Garrison Architecture
- Covered Patio or Porch
About This Home
Located at 12 Merrimack View Ct, Lawrence, MA, this single-family residence presents an exceptional opportunity for the discerning investor or handy homeowner ready to shape their ideal space. This property eagerly awaits its transformation. Within the 790 square feet of living area, the residence offers three bedrooms, providing ample space for a variety of configurations. Consider the possibilities for each room, from peaceful retreats to productive home offices, each tailored to suit your unique lifestyle. The residence includes one full bathroom. A one-car garage offers sheltered parking and additional storage capacity. Outside, the 3053 square foot lot provides a canvas for outdoor enjoyment and landscaping dreams. Built in 1920, this residence awaits your visionary touch to unlock its true potential.
Listing Agent
Alicia Lugo
Home Realty Group LLC Listed on: 12/02/2025
Home Details
Home Type
- Single Family
Est. Annual Taxes
- $2,843
Year Built
- Built in 1920
Lot Details
- 3,053 Sq Ft Lot
- Fenced Yard
- Property is zoned R2
Parking
- 1 Car Detached Garage
- Driveway
- Open Parking
- Off-Street Parking
Home Design
- 790 Sq Ft Home
- Garrison Architecture
- Frame Construction
- Shingle Roof
Kitchen
- Range
- Microwave
- Dishwasher
- Disposal
Flooring
- Granite
- Vinyl
Bedrooms and Bathrooms
- 3 Bedrooms
- 1 Full Bathroom
Laundry
- Dryer
- Washer
Basement
- Partial Basement
- Interior Basement Entry
Outdoor Features
- Covered Deck
- Covered Patio or Porch
Location
- Property is near public transit
- Property is near schools
Schools
- Guilmette Grade Elementary School
- Bruce Middle School
- Lawrence High School
Utilities
- Window Unit Cooling System
- Heating System Uses Natural Gas
- Heating System Uses Steam
- Gas Water Heater
- High Speed Internet
Listing and Financial Details
- Assessor Parcel Number M:0163 B:0000 L:0062,4208347
Community Details
Overview
- No Home Owners Association
Amenities
- Shops
- Coin Laundry
Recreation
- Jogging Path
Map
Home Values in the Area
Average Home Value in this Area
Tax History
| Year | Tax Paid | Tax Assessment Tax Assessment Total Assessment is a certain percentage of the fair market value that is determined by local assessors to be the total taxable value of land and additions on the property. | Land | Improvement |
|---|---|---|---|---|
| 2025 | $2,843 | $323,100 | $96,300 | $226,800 |
| 2024 | $2,786 | $301,200 | $101,100 | $200,100 |
| 2023 | $2,446 | $240,700 | $97,700 | $143,000 |
| 2022 | $2,389 | $208,800 | $92,100 | $116,700 |
| 2021 | $2,351 | $191,600 | $92,100 | $99,500 |
| 2020 | $2,307 | $185,600 | $76,800 | $108,800 |
| 2019 | $2,126 | $155,400 | $57,000 | $98,400 |
| 2018 | $1,952 | $136,300 | $51,700 | $84,600 |
| 2017 | $1,845 | $120,300 | $49,000 | $71,300 |
| 2016 | $1,734 | $111,800 | $38,300 | $73,500 |
| 2015 | $1,690 | $111,800 | $38,300 | $73,500 |
Property History
| Date | Event | Price | List to Sale | Price per Sq Ft |
|---|---|---|---|---|
| 12/02/2025 12/02/25 | For Sale | $415,000 | -- | $525 / Sq Ft |
Purchase History
| Date | Type | Sale Price | Title Company |
|---|---|---|---|
| Warranty Deed | -- | None Available | |
| Warranty Deed | -- | None Available | |
| Deed | $40,000 | -- | |
| Deed | $40,000 | -- | |
| Deed | $40,000 | -- | |
| Foreclosure Deed | $181,883 | -- | |
| Foreclosure Deed | $181,883 | -- | |
| Deed | $72,000 | -- | |
| Deed | $72,000 | -- | |
| Deed | $13,500 | -- | |
| Deed | $13,500 | -- |
Mortgage History
| Date | Status | Loan Amount | Loan Type |
|---|---|---|---|
| Previous Owner | $104,950 | No Value Available | |
| Previous Owner | $97,750 | Purchase Money Mortgage |
Source: MLS Property Information Network (MLS PIN)
MLS Number: 73459021
APN: LAWR-000163-000000-000062
Disclaimer: Certain information contained herein is derived from information provided by parties other than Homes.com. All information provided is deemed reliable, but is not guaranteed to be accurate and should be independently verified.
![]() The property listing data and information, or the Images, set forth herein were provided to MLS Property Information Network, Inc. from third party sources, including sellers, lessors and public records, and were compiled by MLS Property Information Network, Inc. The property listing data and information, and the Images, are for the personal, non-commercial use of consumers having a good faith interest in purchasing or leasing listed properties of the type displayed to them and may not be used for any purpose other than to identify prospective properties which such consumers may have a good faith interest in purchasing or leasing. MLS Property Information Network, Inc. and its subscribers disclaim any and all representations and warranties as to the accuracy of the property listing data and information, or as to the accuracy of any of the Images, set forth herein.
The property listing data and information, or the Images, set forth herein were provided to MLS Property Information Network, Inc. from third party sources, including sellers, lessors and public records, and were compiled by MLS Property Information Network, Inc. The property listing data and information, and the Images, are for the personal, non-commercial use of consumers having a good faith interest in purchasing or leasing listed properties of the type displayed to them and may not be used for any purpose other than to identify prospective properties which such consumers may have a good faith interest in purchasing or leasing. MLS Property Information Network, Inc. and its subscribers disclaim any and all representations and warranties as to the accuracy of the property listing data and information, or as to the accuracy of any of the Images, set forth herein.
- 55-59 Water St
- 95 Hancock St
- 312 Water St Unit 36
- 45 Bodwell St
- 82 Water St
- 2 Lansdowne Ct
- 58 Crosby St
- 30-32 Linden St
- 13 Kingston St
- 1008 Essex St Unit 1010
- 91-93 Newton St
- 18 Ames St
- 44-46 Butler St
- 62-66 Butler St
- 8 Packard St
- 82 S Broadway
- 37 Tewksbury St Unit 39
- 132-134 S Broadway
- 629 Andover St
- 265 Ames St
- 81-83 Greenwood St Unit 3rd Floor
- 26 Ames St Unit 3
- 69 Nesmith St Unit 69
- 300 Methuen St
- 202 Broadway Unit 2-3
- 170 Salem St Unit 3
- 476-478 Riverside Dr
- 107 A Chester St Unit 107A
- 23 Brookfield St Unit 2
- 51 Forest St Unit 1
- 2 Reservoir Terrace Unit 4
- 369 Haverhill St Unit 606
- 369 Haverhill St Unit 605
- 300 Canal St Unit 6-512
- 300 Canal St Unit 5-101
- 300 Canal St Unit 5-103
- 31 Dunstable St
- 300 Canal St
- 280 Essex St Unit 303
- 280 Essex St Unit 402
