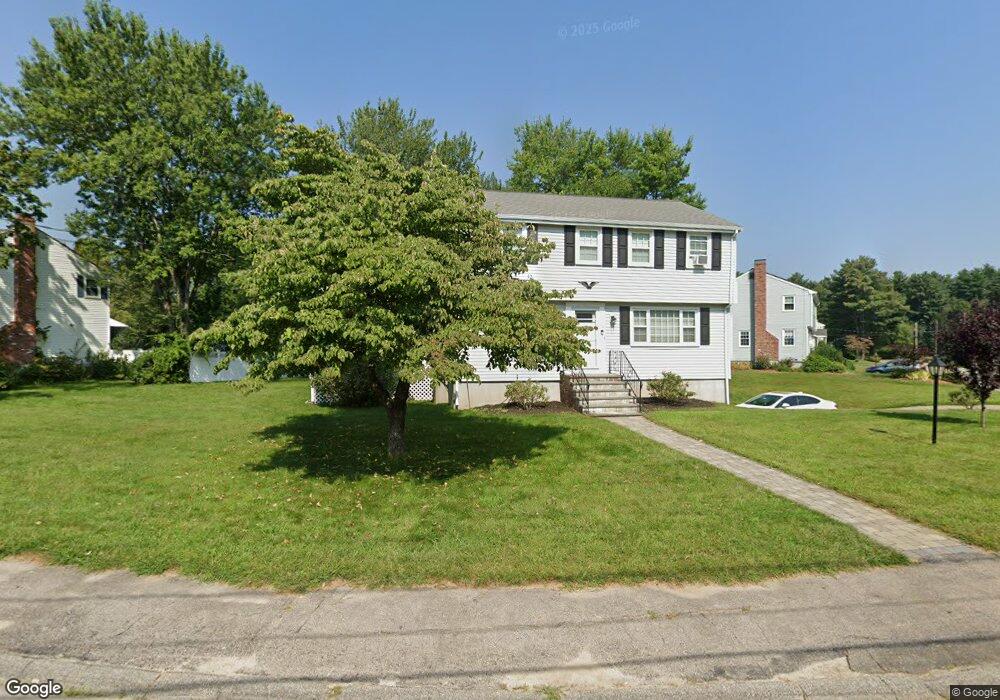
12 Mohawk Path Bellingham, MA 02019
Estimated Value: $550,182 - $707,000
4
Beds
2
Baths
2,032
Sq Ft
$306/Sq Ft
Est. Value
About This Home
This home is located at 12 Mohawk Path, Bellingham, MA 02019 and is currently estimated at $621,546, approximately $305 per square foot. 12 Mohawk Path is a home located in Norfolk County with nearby schools including Stall Brook Elementary School, Bellingham High School, and Mendon Mennonite School.
Ownership History
Date
Name
Owned For
Owner Type
Purchase Details
Closed on
Oct 11, 2016
Sold by
Oglishen Paul D and Oglishen Dann M
Bought by
Dennison Dann M
Current Estimated Value
Purchase Details
Closed on
Nov 15, 1993
Sold by
Beggs Virginia E
Bought by
Oglishen Paul D and Oglishen Dann M
Home Financials for this Owner
Home Financials are based on the most recent Mortgage that was taken out on this home.
Original Mortgage
$122,850
Interest Rate
6.79%
Mortgage Type
Purchase Money Mortgage
Create a Home Valuation Report for This Property
The Home Valuation Report is an in-depth analysis detailing your home's value as well as a comparison with similar homes in the area
Home Values in the Area
Average Home Value in this Area
Purchase History
| Date | Buyer | Sale Price | Title Company |
|---|---|---|---|
| Dennison Dann M | -- | -- | |
| Oglishen Paul D | $136,500 | -- | |
| Oglishen Paul D | $136,500 | -- |
Source: Public Records
Mortgage History
| Date | Status | Borrower | Loan Amount |
|---|---|---|---|
| Previous Owner | Oglishen Paul D | $122,850 |
Source: Public Records
Tax History
| Year | Tax Paid | Tax Assessment Tax Assessment Total Assessment is a certain percentage of the fair market value that is determined by local assessors to be the total taxable value of land and additions on the property. | Land | Improvement |
|---|---|---|---|---|
| 2025 | $5,349 | $425,900 | $166,100 | $259,800 |
| 2024 | $5,129 | $398,800 | $151,700 | $247,100 |
| 2023 | $4,943 | $378,800 | $144,400 | $234,400 |
| 2022 | $4,817 | $342,100 | $120,400 | $221,700 |
| 2021 | $4,682 | $324,900 | $120,400 | $204,500 |
| 2020 | $4,432 | $311,700 | $120,400 | $191,300 |
| 2019 | $4,337 | $305,200 | $120,400 | $184,800 |
| 2018 | $4,048 | $280,900 | $115,800 | $165,100 |
| 2017 | $3,944 | $275,000 | $115,800 | $159,200 |
| 2016 | $3,765 | $263,500 | $113,900 | $149,600 |
| 2015 | $3,611 | $253,400 | $109,500 | $143,900 |
| 2014 | $3,625 | $247,300 | $107,000 | $140,300 |
Source: Public Records
Map
Nearby Homes
- 17 Pine St
- 44 Arapahoe Rd
- 60 Pine St
- 18 Mary Anne Dr
- 462 Hartford Ave
- 39 West St
- 276 Pond St
- 10 Franklin St
- 22 Granite St
- 6 Freedom Trail
- 201 Crossfield Rd
- 15 Fox Run Rd
- 8 Woodhaven Dr
- 214 Conlyn Ave
- 4 Shaw St
- 6 Kingson Ln Unit 2
- 0 Hixon St Unit 73477486
- 8 Riverstone Way
- 38 Conlyn Ave
- 25 Brookview Rd
- 13 Mohawk Path
- 11 Mohawk Path
- 18 Mohawk Path
- 17 Mohawk Path
- 15 Mohawk Path
- 19 Mohawk Path
- 20 Mohawk Path
- 7 Mohawk Path
- 4 Mohawk Path
- 124 Plymouth Rd
- 21 Mohawk Path
- 24 Mohawk Path
- 23 Mohawk Path
- 3 Mohawk Path
- 120 Plymouth Rd
- 139 Plymouth Rd
- 30 Mohawk Path
- 125 Plymouth Rd
- 17 Bainbridge Rd
- 25 Mohawk Path
Your Personal Tour Guide
Ask me questions while you tour the home.