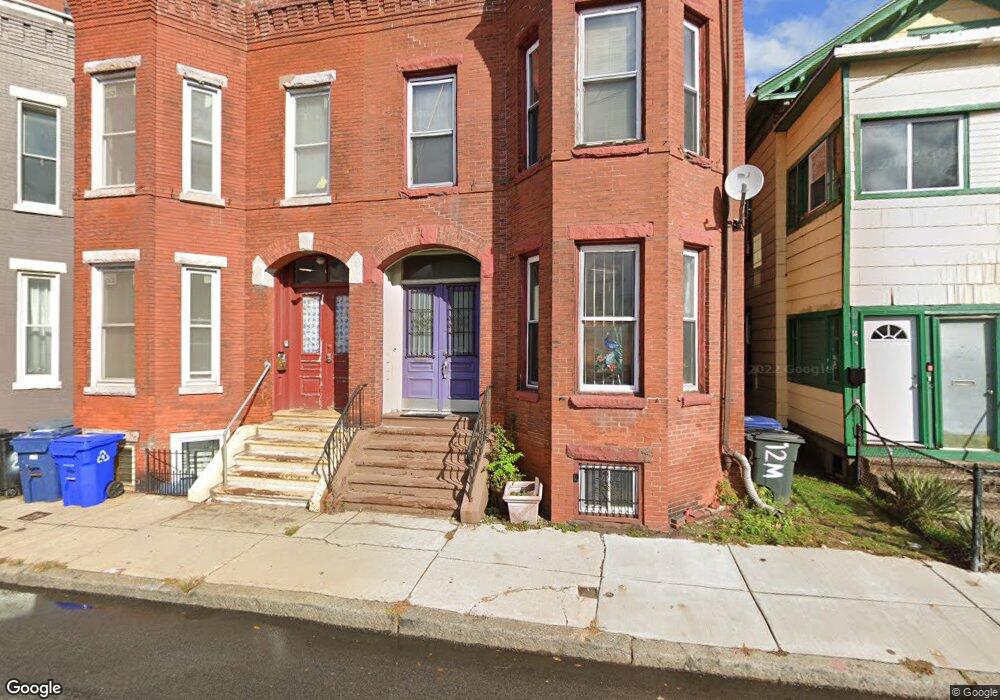
12 Moreland St Roxbury, MA 02119
Sav-Mor NeighborhoodEstimated Value: $669,028 - $1,022,000
3
Beds
1
Bath
2,140
Sq Ft
$359/Sq Ft
Est. Value
About This Home
This home is located at 12 Moreland St, Roxbury, MA 02119 and is currently estimated at $769,257, approximately $359 per square foot. 12 Moreland St is a home located in Suffolk County with nearby schools including City on a Hill Charter Public School.
Ownership History
Date
Name
Owned For
Owner Type
Purchase Details
Closed on
Apr 13, 1998
Sold by
Neville John H and Neville Patricia A
Bought by
Walton Carole E
Current Estimated Value
Create a Home Valuation Report for This Property
The Home Valuation Report is an in-depth analysis detailing your home's value as well as a comparison with similar homes in the area
Home Values in the Area
Average Home Value in this Area
Purchase History
| Date | Buyer | Sale Price | Title Company |
|---|---|---|---|
| Walton Carole E | $120,000 | -- |
Source: Public Records
Mortgage History
| Date | Status | Borrower | Loan Amount |
|---|---|---|---|
| Open | Walton Carole E | $225,000 | |
| Closed | Walton Carole E | $114,480 | |
| Closed | Walton Carole E | $50,000 |
Source: Public Records
Tax History Compared to Growth
Tax History
| Year | Tax Paid | Tax Assessment Tax Assessment Total Assessment is a certain percentage of the fair market value that is determined by local assessors to be the total taxable value of land and additions on the property. | Land | Improvement |
|---|---|---|---|---|
| 2025 | $6,040 | $521,600 | $147,300 | $374,300 |
| 2024 | $5,931 | $544,100 | $148,600 | $395,500 |
| 2023 | $5,844 | $544,100 | $148,600 | $395,500 |
| 2022 | $5,382 | $494,700 | $135,100 | $359,600 |
| 2021 | $5,278 | $494,700 | $135,100 | $359,600 |
| 2020 | $4,846 | $458,900 | $131,500 | $327,400 |
| 2019 | $4,521 | $428,900 | $103,300 | $325,600 |
| 2018 | $4,087 | $390,000 | $103,300 | $286,700 |
| 2017 | $4,008 | $378,500 | $103,300 | $275,200 |
| 2016 | $3,966 | $360,500 | $103,300 | $257,200 |
| 2015 | $3,683 | $304,100 | $64,900 | $239,200 |
| 2014 | $3,714 | $295,200 | $64,900 | $230,300 |
Source: Public Records
Map
Nearby Homes
- 20 Rockville Park
- 22 Rockville Park
- 37 Regent St Unit 2
- 51 Saint James St
- 91 Zeigler St
- 250 Dudley St Unit 1
- 10 Taber St Unit 501
- 2 Mount Pleasant Place Unit 2
- 30 Copeland St Unit 1
- 101 Mount Pleasant Ave
- 33 Copeland Park Unit C
- 108 Mount Pleasant Ave Unit 108R
- 38 Juniper St
- 10 Rockland St Unit 4
- 7 Langford Park Unit 3
- 9 W Cedar St Unit 1
- 94 Walnut Ave
- 59 Perrin St
- 59 Perrin St Unit 1
- 27 Dudley St
- 14 Moreland St
- 10 Moreland St Unit 2
- 10 Moreland St Unit 1
- 10 Moreland St
- 10 Moreland St Unit Moreland St
- 10 Moreland St
- 8 Moreland St
- 16 Moreland St
- 6 Moreland St Unit 3
- 6 Moreland St Unit 1
- 6 Moreland St Unit 5A
- 6 Moreland St Unit 4
- 6 Moreland St
- 4 Moreland St Unit 4
- 20 Moreland St Unit 1
- 20 Moreland St Unit 2
- 13 Winthrop St
- 11 Winthrop St
- 11 Winthrop St Unit 1
- 11 Winthrop St Unit 2