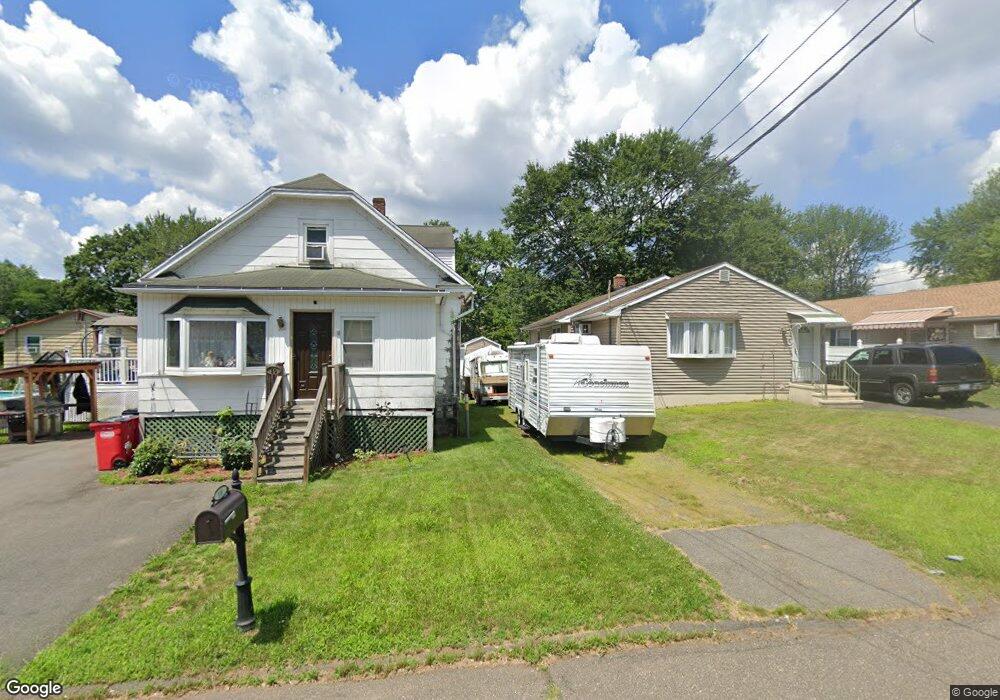
12 Morse St Meriden, CT 06450
Estimated Value: $213,361 - $249,000
2
Beds
1
Bath
952
Sq Ft
$245/Sq Ft
Est. Value
About This Home
This home is located at 12 Morse St, Meriden, CT 06450 and is currently estimated at $232,840, approximately $244 per square foot. 12 Morse St is a home located in New Haven County with nearby schools including Nathan Hale Elementary School, Washington Middle School, and Francis T. Maloney High School.
Ownership History
Date
Name
Owned For
Owner Type
Purchase Details
Closed on
Dec 29, 2006
Sold by
Malaran Lord M and Malaran Hazel S
Bought by
Stoyak Peter J
Current Estimated Value
Home Financials for this Owner
Home Financials are based on the most recent Mortgage that was taken out on this home.
Original Mortgage
$166,388
Outstanding Balance
$99,370
Interest Rate
6.29%
Mortgage Type
Purchase Money Mortgage
Estimated Equity
$133,470
Purchase Details
Closed on
Dec 4, 2003
Sold by
Sirianni Greg
Bought by
Malaran Lord M and Malaran Hazel S
Home Financials for this Owner
Home Financials are based on the most recent Mortgage that was taken out on this home.
Original Mortgage
$129,900
Interest Rate
6.03%
Mortgage Type
Purchase Money Mortgage
Purchase Details
Closed on
Oct 26, 2001
Sold by
Weiss Jacob E and Weiss Catherine A
Bought by
Sirianni Greg
Home Financials for this Owner
Home Financials are based on the most recent Mortgage that was taken out on this home.
Original Mortgage
$97,850
Interest Rate
6.38%
Mortgage Type
Purchase Money Mortgage
Create a Home Valuation Report for This Property
The Home Valuation Report is an in-depth analysis detailing your home's value as well as a comparison with similar homes in the area
Home Values in the Area
Average Home Value in this Area
Purchase History
| Date | Buyer | Sale Price | Title Company |
|---|---|---|---|
| Stoyak Peter J | $169,000 | -- | |
| Malaran Lord M | $134,000 | -- | |
| Sirianni Greg | $103,000 | -- |
Source: Public Records
Mortgage History
| Date | Status | Borrower | Loan Amount |
|---|---|---|---|
| Open | Sirianni Greg | $166,388 | |
| Previous Owner | Sirianni Greg | $129,900 | |
| Previous Owner | Sirianni Greg | $97,850 |
Source: Public Records
Tax History Compared to Growth
Tax History
| Year | Tax Paid | Tax Assessment Tax Assessment Total Assessment is a certain percentage of the fair market value that is determined by local assessors to be the total taxable value of land and additions on the property. | Land | Improvement |
|---|---|---|---|---|
| 2025 | $3,759 | $93,730 | $0 | $93,730 |
| 2024 | $3,403 | $93,730 | $0 | $93,730 |
| 2023 | $3,261 | $93,730 | $0 | $93,730 |
| 2022 | $3,092 | $93,730 | $0 | $93,730 |
| 2021 | $2,826 | $69,160 | $0 | $69,160 |
| 2020 | $2,826 | $69,160 | $0 | $69,160 |
| 2019 | $2,829 | $69,230 | $0 | $69,230 |
| 2018 | $2,841 | $69,230 | $0 | $69,230 |
| 2017 | $2,764 | $69,230 | $0 | $69,230 |
| 2016 | $3,628 | $99,050 | $0 | $99,050 |
| 2015 | $3,628 | $99,050 | $0 | $99,050 |
| 2014 | $3,540 | $99,050 | $0 | $99,050 |
Source: Public Records
Map
Nearby Homes
- 52 Oakland Ct
- 303 Blackstone Village
- 106 Blackstone Village Unit 106
- 181 Hicks St Unit 2C
- 882 N Colony Rd Unit 61
- 882 N Colony Rd Unit 2
- 882 N Colony Rd Unit 28
- 929 N Colony Rd Unit 6
- 51 Griswold St
- 109 Hicks St
- 69 Putnam St
- 396 Gracey Ave
- 334 Gracey Ave
- 99 Dogwood Ln
- 47 Dogwood Ln
- 19 Dogwood Ln
- 497 Gracey Ave
- 50 Quarry Farms Unit 48
- 1069 N Colony Rd
- 584 Gracey Ave