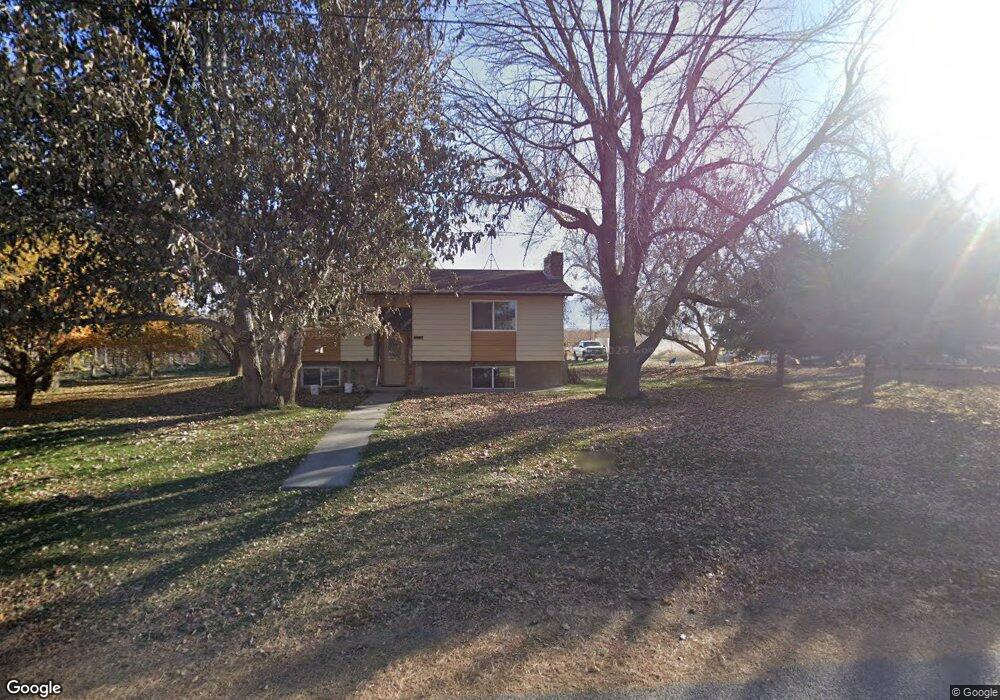
12 N Main St Genola, UT 84655
Estimated Value: $400,322 - $536,000
2
Beds
4
Baths
832
Sq Ft
$551/Sq Ft
Est. Value
About This Home
This home is located at 12 N Main St, Genola, UT 84655 and is currently estimated at $458,331, approximately $550 per square foot. 12 N Main St is a home located in Utah County with nearby schools including Goshen Elementary school, Mt. Nebo Junior High School, and Mt. Nebo Middle.
Ownership History
Date
Name
Owned For
Owner Type
Purchase Details
Closed on
May 9, 2024
Sold by
Ewell Neal M and Ewell Sherie B
Bought by
Neal Milo Ewell And Sherie B Ewell Family Tru and Ewell
Current Estimated Value
Purchase Details
Closed on
Apr 30, 2001
Sold by
Ewell Neal Milo
Bought by
Ewell Neal M and Ewell Sherie B
Home Financials for this Owner
Home Financials are based on the most recent Mortgage that was taken out on this home.
Original Mortgage
$48,000
Interest Rate
6.92%
Purchase Details
Closed on
May 29, 1997
Sold by
Beveridge John N
Bought by
Hickam Jeff M and Hickam Shelly M
Home Financials for this Owner
Home Financials are based on the most recent Mortgage that was taken out on this home.
Original Mortgage
$100,000
Interest Rate
8.13%
Mortgage Type
Purchase Money Mortgage
Create a Home Valuation Report for This Property
The Home Valuation Report is an in-depth analysis detailing your home's value as well as a comparison with similar homes in the area
Home Values in the Area
Average Home Value in this Area
Purchase History
| Date | Buyer | Sale Price | Title Company |
|---|---|---|---|
| Neal Milo Ewell And Sherie B Ewell Family Tru | -- | None Listed On Document | |
| Ewell Neal M | -- | Pro Title & Escrow Inc | |
| Hickam Jeff M | -- | -- |
Source: Public Records
Mortgage History
| Date | Status | Borrower | Loan Amount |
|---|---|---|---|
| Previous Owner | Ewell Neal M | $48,000 | |
| Previous Owner | Hickam Jeff M | $100,000 | |
| Closed | Hickam Jeff M | $40,000 |
Source: Public Records
Tax History Compared to Growth
Tax History
| Year | Tax Paid | Tax Assessment Tax Assessment Total Assessment is a certain percentage of the fair market value that is determined by local assessors to be the total taxable value of land and additions on the property. | Land | Improvement |
|---|---|---|---|---|
| 2025 | $1,513 | $177,540 | $152,000 | $170,800 |
| 2024 | $1,513 | $156,530 | $0 | $0 |
| 2023 | $1,493 | $154,715 | $0 | $0 |
| 2022 | $1,716 | $176,660 | $0 | $0 |
| 2021 | $1,451 | $239,500 | $102,900 | $136,600 |
| 2020 | $1,387 | $222,100 | $89,500 | $132,600 |
| 2019 | $1,267 | $208,800 | $76,200 | $132,600 |
| 2018 | $1,143 | $181,600 | $66,300 | $115,300 |
| 2017 | $776 | $66,279 | $0 | $0 |
| 2016 | $688 | $59,072 | $0 | $0 |
| 2015 | $622 | $52,801 | $0 | $0 |
| 2014 | $555 | $47,360 | $0 | $0 |
Source: Public Records
Map
Nearby Homes
- 956 N Main St
- 1010 S Anna Ekins Memorial Ln
- 975 E 715 S
- 1220 N Hillside Dr
- 686 W Frost St Unit 86
- 346 Red Rock Dr
- 402 Topaz Dr
- 583 Sunset Dr
- 263 N Polly Ln
- 263 Polly Ln Unit 8
- 259 N Polly Ln
- 259 N Polly Ln Unit 7
- 255 Polly Ln Unit 6
- 255 N Polly Ln
- 251 N Polly Ln
- 251 N Polly Ln Unit 4
- 245 N Polly Ln Unit 2
- 245 N Polly Ln
- 241 N Polly Ln Unit 1
- 1896 S Marigold Way Unit 443