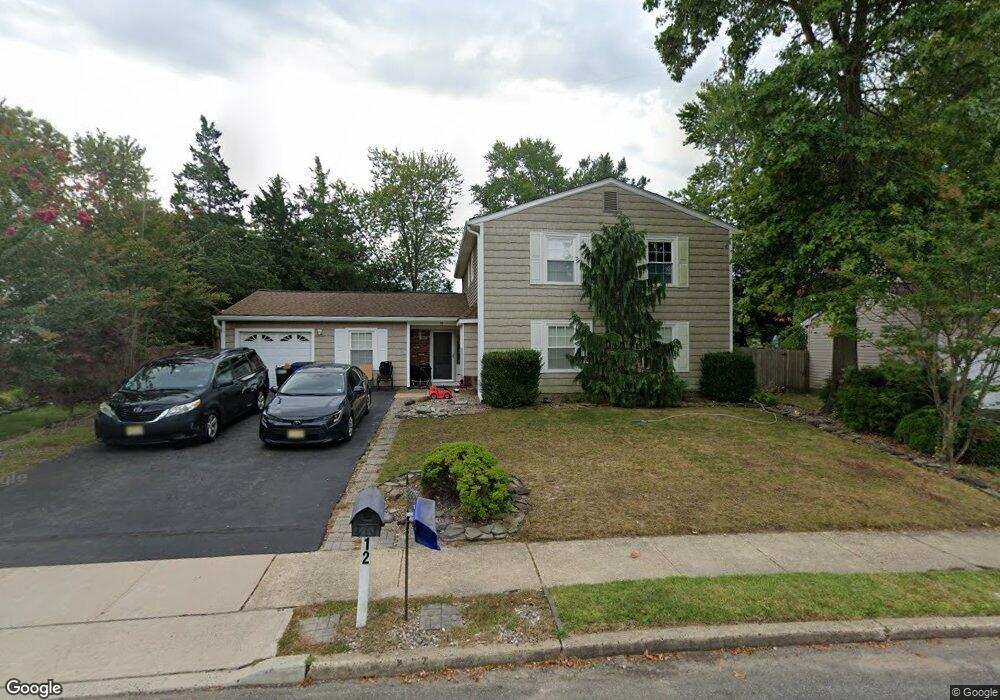
12 Nantucket Ct Howell, NJ 07731
Southard NeighborhoodEstimated Value: $729,000 - $770,269
3
Beds
3
Baths
2,488
Sq Ft
$303/Sq Ft
Est. Value
About This Home
This home is located at 12 Nantucket Ct, Howell, NJ 07731 and is currently estimated at $754,567, approximately $303 per square foot. 12 Nantucket Ct is a home located in Monmouth County with nearby schools including Taunton School, Aldrich School, and Howell Township Middle School South.
Ownership History
Date
Name
Owned For
Owner Type
Purchase Details
Closed on
Jul 30, 2024
Sold by
Polatschek Bernard A and Polatschek Clare
Bought by
Braunfeld Zalman and Braunfeld Kaila
Current Estimated Value
Home Financials for this Owner
Home Financials are based on the most recent Mortgage that was taken out on this home.
Original Mortgage
$490,000
Outstanding Balance
$484,455
Interest Rate
6.87%
Mortgage Type
New Conventional
Estimated Equity
$270,112
Create a Home Valuation Report for This Property
The Home Valuation Report is an in-depth analysis detailing your home's value as well as a comparison with similar homes in the area
Home Values in the Area
Average Home Value in this Area
Purchase History
| Date | Buyer | Sale Price | Title Company |
|---|---|---|---|
| Braunfeld Zalman | $740,000 | Wellington Abstract | |
| Braunfeld Zalman | $740,000 | Wellington Abstract |
Source: Public Records
Mortgage History
| Date | Status | Borrower | Loan Amount |
|---|---|---|---|
| Open | Braunfeld Zalman | $490,000 | |
| Closed | Braunfeld Zalman | $490,000 |
Source: Public Records
Tax History Compared to Growth
Tax History
| Year | Tax Paid | Tax Assessment Tax Assessment Total Assessment is a certain percentage of the fair market value that is determined by local assessors to be the total taxable value of land and additions on the property. | Land | Improvement |
|---|---|---|---|---|
| 2025 | $11,255 | $690,600 | $380,000 | $310,600 |
| 2024 | $11,101 | $633,000 | $328,000 | $305,000 |
| 2023 | $11,101 | $596,500 | $278,000 | $318,500 |
| 2022 | $7,502 | $466,300 | $163,000 | $303,300 |
| 2021 | $7,502 | $427,800 | $158,000 | $269,800 |
| 2020 | $9,611 | $413,900 | $147,200 | $266,700 |
| 2019 | $9,940 | $420,100 | $158,000 | $262,100 |
| 2018 | $9,236 | $387,900 | $138,000 | $249,900 |
| 2017 | $9,037 | $375,300 | $133,000 | $242,300 |
| 2016 | $8,614 | $354,200 | $118,000 | $236,200 |
| 2015 | $8,993 | $366,000 | $118,000 | $248,000 |
| 2014 | $8,079 | $305,100 | $108,000 | $197,100 |
Source: Public Records
Map
Nearby Homes
- 11 Nantucket Ct
- 14 Cobblestone Ct
- 9 Bell Ct
- 10 Cove Ct
- 99 Glen Arden Dr
- 10 Colonial Ct
- 7 Lamp Post Ct
- 12 Colonial Ct
- 9 Cove Ct
- 21 Bunker Hill Dr
- 21 Cannon Ball Dr
- 166 Friendship Rd
- 91 Concord Cir
- 12 Glen Arden Dr
- 5 Weasel Creek Ct
- 18 Plymouth Dr
- 12 Dantley Dr
- 14 Plymouth Dr
- 47 Glen Rd
- 30 Heritage Dr