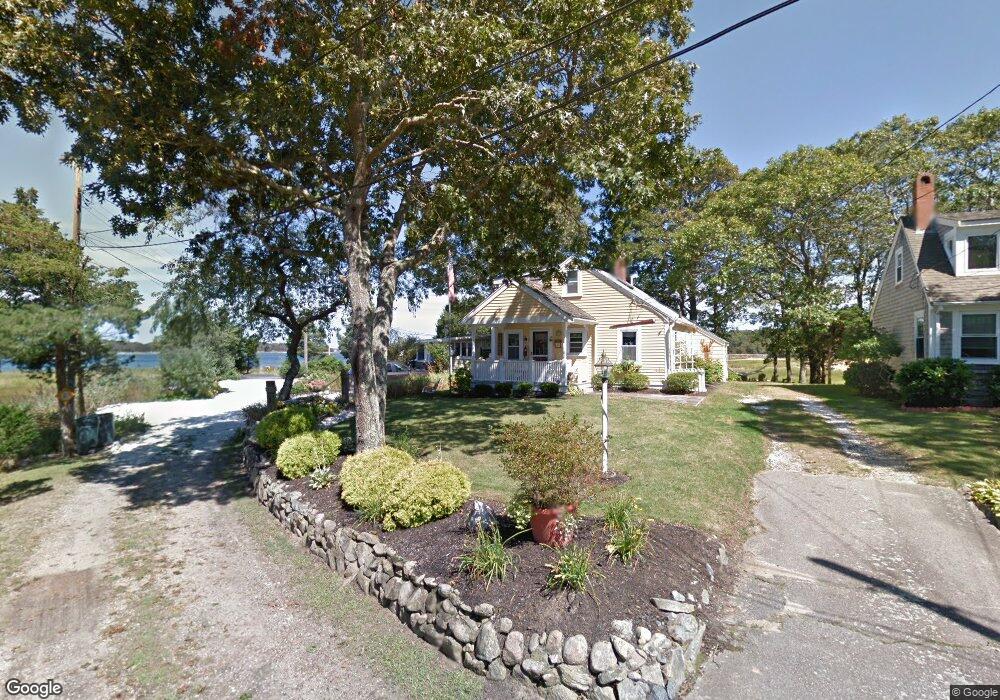
12 Navajo Rd Pocasset, MA 02559
Pocasset NeighborhoodEstimated Value: $726,000 - $876,333
4
Beds
2
Baths
1,001
Sq Ft
$822/Sq Ft
Est. Value
About This Home
This home is located at 12 Navajo Rd, Pocasset, MA 02559 and is currently estimated at $822,583, approximately $821 per square foot. 12 Navajo Rd is a home located in Barnstable County with nearby schools including Bourne High School, Cadence Academy Preschool - Bourne, and St Margaret Regional School.
Ownership History
Date
Name
Owned For
Owner Type
Purchase Details
Closed on
Mar 26, 2007
Sold by
Phillips-Cheshire Layla
Bought by
12 Navajo Road Ret and Cheshire
Current Estimated Value
Purchase Details
Closed on
Jan 6, 2004
Sold by
Hagelstein Ft and Hagelstein Isabella D
Bought by
Chesire Layla Phillips
Home Financials for this Owner
Home Financials are based on the most recent Mortgage that was taken out on this home.
Original Mortgage
$343,920
Interest Rate
5.86%
Mortgage Type
Purchase Money Mortgage
Create a Home Valuation Report for This Property
The Home Valuation Report is an in-depth analysis detailing your home's value as well as a comparison with similar homes in the area
Home Values in the Area
Average Home Value in this Area
Purchase History
| Date | Buyer | Sale Price | Title Company |
|---|---|---|---|
| 12 Navajo Road Ret | -- | -- | |
| 12 Navajo Road Ret | -- | -- | |
| Chesire Layla Phillips | $429,900 | -- | |
| Chesire Layla Phillips | $429,900 | -- |
Source: Public Records
Mortgage History
| Date | Status | Borrower | Loan Amount |
|---|---|---|---|
| Open | Chesire Layla Phillips | $92,700 | |
| Previous Owner | Chesire Layla Phillips | $343,920 |
Source: Public Records
Tax History Compared to Growth
Tax History
| Year | Tax Paid | Tax Assessment Tax Assessment Total Assessment is a certain percentage of the fair market value that is determined by local assessors to be the total taxable value of land and additions on the property. | Land | Improvement |
|---|---|---|---|---|
| 2025 | $6,361 | $814,500 | $527,400 | $287,100 |
| 2024 | $6,220 | $775,500 | $502,300 | $273,200 |
| 2023 | $6,025 | $683,900 | $444,600 | $239,300 |
| 2022 | $5,888 | $583,500 | $393,400 | $190,100 |
| 2021 | $5,720 | $531,100 | $358,000 | $173,100 |
| 2020 | $3,895 | $519,300 | $354,600 | $164,700 |
| 2019 | $5,360 | $510,000 | $354,600 | $155,400 |
| 2018 | $3,900 | $478,600 | $337,800 | $140,800 |
| 2017 | $4,882 | $474,000 | $334,600 | $139,400 |
| 2016 | $4,750 | $467,500 | $334,600 | $132,900 |
| 2015 | $4,483 | $445,200 | $312,300 | $132,900 |
Source: Public Records
Map
Nearby Homes