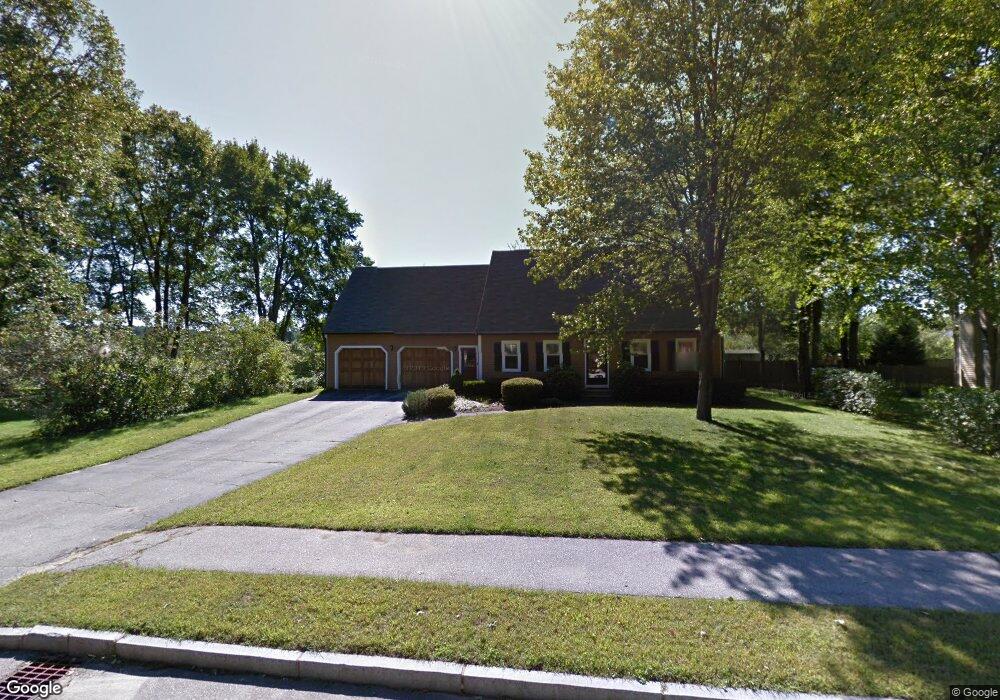
12 New Castle St Concord, NH 03301
South End NeighborhoodEstimated Value: $597,903 - $804,000
3
Beds
2
Baths
2,240
Sq Ft
$307/Sq Ft
Est. Value
About This Home
This home is located at 12 New Castle St, Concord, NH 03301 and is currently estimated at $688,476, approximately $307 per square foot. 12 New Castle St is a home located in Merrimack County with nearby schools including Abbot-Downing School, Rundlett Middle School, and Concord High School.
Ownership History
Date
Name
Owned For
Owner Type
Purchase Details
Closed on
Sep 30, 2010
Sold by
Mollica Ruth E
Bought by
Racine Keith G and Racine Angela M
Current Estimated Value
Home Financials for this Owner
Home Financials are based on the most recent Mortgage that was taken out on this home.
Original Mortgage
$261,478
Outstanding Balance
$173,336
Interest Rate
4.44%
Mortgage Type
Purchase Money Mortgage
Estimated Equity
$515,140
Purchase Details
Closed on
Sep 24, 2001
Sold by
Sheehy Carol
Bought by
Mollica John W and Mollica Ruth E
Create a Home Valuation Report for This Property
The Home Valuation Report is an in-depth analysis detailing your home's value as well as a comparison with similar homes in the area
Home Values in the Area
Average Home Value in this Area
Purchase History
| Date | Buyer | Sale Price | Title Company |
|---|---|---|---|
| Racine Keith G | $265,000 | -- | |
| Mollica John W | $220,000 | -- |
Source: Public Records
Mortgage History
| Date | Status | Borrower | Loan Amount |
|---|---|---|---|
| Open | Mollica John W | $261,478 |
Source: Public Records
Tax History Compared to Growth
Tax History
| Year | Tax Paid | Tax Assessment Tax Assessment Total Assessment is a certain percentage of the fair market value that is determined by local assessors to be the total taxable value of land and additions on the property. | Land | Improvement |
|---|---|---|---|---|
| 2024 | $11,057 | $399,300 | $123,000 | $276,300 |
| 2023 | $10,435 | $388,500 | $123,000 | $265,500 |
| 2022 | $10,058 | $388,500 | $123,000 | $265,500 |
| 2021 | $9,631 | $383,400 | $123,000 | $260,400 |
| 2020 | $9,355 | $349,600 | $96,900 | $252,700 |
| 2019 | $8,781 | $316,100 | $100,600 | $215,500 |
| 2018 | $8,516 | $302,100 | $101,000 | $201,100 |
| 2017 | $8,271 | $292,900 | $101,000 | $191,900 |
| 2016 | $7,775 | $281,000 | $99,200 | $181,800 |
| 2015 | $7,464 | $272,100 | $107,500 | $164,600 |
| 2014 | $7,295 | $272,100 | $107,500 | $164,600 |
| 2013 | -- | $268,900 | $107,500 | $161,400 |
| 2012 | -- | $267,800 | $113,200 | $154,600 |
Source: Public Records
Map
Nearby Homes
- 22 Wilson Ave
- 15 Wilson Ave
- 0 South St Unit 4969509
- 122 South St
- 12 Avon St
- 289 South St
- 105 S Main St
- 376 S Main St
- 2 Kensington Rd
- 0 Spruce St Unit 88
- 1 Kensington Rd
- 33 Spruce St
- 24 Pierce St
- 47 South St
- 53 Heather Ln
- 14 Downing St
- 14-16 Perley St
- 10 Perley St
- 87 S Main St Unit 2
- 54 Pleasant St Unit 8
- 10 New Castle St
- 14 New Castle St
- 8 New Castle St
- 11 New Castle St
- 9 New Castle St
- 13 New Castle St
- 7 New Castle St
- 16 New Castle St
- 6 New Castle St
- 15 New Castle St
- 5 New Castle St
- 12 Middlebury St
- 10 Middlebury St
- 14 Middlebury St
- 4 New Castle St
- 18 New Castle St
- 8 Middlebury St
- 3 New Castle St
- 17 New Castle St
- 16 Middlebury St