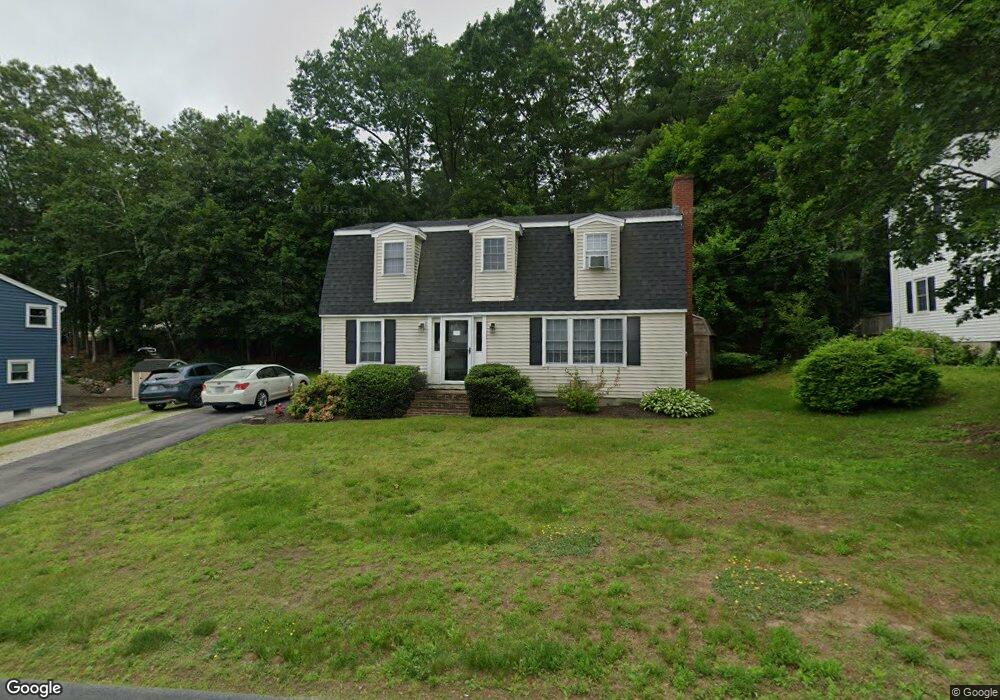
12 Nottingham Dr Nashua, NH 03062
Southwest Nashua NeighborhoodEstimated Value: $528,000 - $550,452
4
Beds
2
Baths
1,728
Sq Ft
$314/Sq Ft
Est. Value
About This Home
This home is located at 12 Nottingham Dr, Nashua, NH 03062 and is currently estimated at $542,363, approximately $313 per square foot. 12 Nottingham Dr is a home located in Hillsborough County with nearby schools including New Searles School, Fairgrounds Middle School, and Nashua High School South.
Ownership History
Date
Name
Owned For
Owner Type
Purchase Details
Closed on
Feb 8, 2023
Sold by
Doyle James P and Doyle Denise M
Bought by
Sullivan Cheryl A
Current Estimated Value
Home Financials for this Owner
Home Financials are based on the most recent Mortgage that was taken out on this home.
Original Mortgage
$367,571
Outstanding Balance
$355,826
Interest Rate
6.42%
Mortgage Type
FHA
Estimated Equity
$186,537
Purchase Details
Closed on
Dec 20, 2002
Sold by
Buxton Steve M and Buxton Heidi D
Bought by
Doyle James P and Doyle Denise M
Home Financials for this Owner
Home Financials are based on the most recent Mortgage that was taken out on this home.
Original Mortgage
$243,092
Interest Rate
6.16%
Mortgage Type
Purchase Money Mortgage
Purchase Details
Closed on
Mar 19, 1998
Sold by
Geisinge Gregory James
Bought by
Buxton Steve M and Buxton Heidi D
Create a Home Valuation Report for This Property
The Home Valuation Report is an in-depth analysis detailing your home's value as well as a comparison with similar homes in the area
Home Values in the Area
Average Home Value in this Area
Purchase History
| Date | Buyer | Sale Price | Title Company |
|---|---|---|---|
| Sullivan Cheryl A | $425,000 | None Available | |
| Doyle James P | $247,900 | -- | |
| Buxton Steve M | $123,900 | -- |
Source: Public Records
Mortgage History
| Date | Status | Borrower | Loan Amount |
|---|---|---|---|
| Open | Sullivan Cheryl A | $367,571 | |
| Previous Owner | Buxton Steve M | $40,000 | |
| Previous Owner | Buxton Steve M | $240,000 | |
| Previous Owner | Buxton Steve M | $19,000 | |
| Previous Owner | Buxton Steve M | $243,092 |
Source: Public Records
Tax History Compared to Growth
Tax History
| Year | Tax Paid | Tax Assessment Tax Assessment Total Assessment is a certain percentage of the fair market value that is determined by local assessors to be the total taxable value of land and additions on the property. | Land | Improvement |
|---|---|---|---|---|
| 2024 | $7,177 | $451,400 | $162,600 | $288,800 |
| 2023 | $6,896 | $378,300 | $130,100 | $248,200 |
| 2022 | $6,836 | $378,300 | $130,100 | $248,200 |
| 2021 | $6,190 | $266,600 | $86,700 | $179,900 |
| 2020 | $6,028 | $266,600 | $86,700 | $179,900 |
| 2019 | $5,801 | $266,600 | $86,700 | $179,900 |
| 2018 | $5,655 | $266,600 | $86,700 | $179,900 |
| 2017 | $5,731 | $222,200 | $67,500 | $154,700 |
| 2016 | $5,571 | $222,200 | $67,500 | $154,700 |
| 2015 | $5,451 | $222,200 | $67,500 | $154,700 |
| 2014 | $5,344 | $222,200 | $67,500 | $154,700 |
Source: Public Records
Map
Nearby Homes
- 29 Greenwood Dr
- 23 Glen Dr
- 33 Cannon Dr
- 4 Henry David Dr Unit 203
- 57 Wethersfield Rd
- 5 Wilderness Dr
- 5 Appaloosa Place
- 15 Westray Dr
- 29 Dickens St
- 11 Bordeaux St
- 31 Tenby Dr
- 22 Kern Dr
- 17 Herrick St
- 9 Byron Dr
- 63 Dexter St
- 97 Linwood St
- 375 Main Dunstable Rd
- 247 Main Dunstable Rd
- 15 Learned St Unit 123
- 6 Hayden St
- 14 Nottingham Dr
- 13 Nottingham Dr
- 11 Nottingham Dr
- 6 Barnesdale Rd
- 10 Nottingham Dr
- 4 Barnesdale Rd
- 10 Barnesdale Rd
- 2 Lancaster Dr
- 4 Lancaster Dr
- 15 Nottingham Dr
- 9 Nottingham Dr
- 22 Greenwood Dr
- 20 Greenwood Dr
- 3 Barnesdale Rd
- 24 Greenwood Dr
- 17 Nottingham Dr
- 5 Barnesdale Rd
- 8 Nottingham Dr
- 7 Barnesdale Rd
- 1 Barnesdale Rd