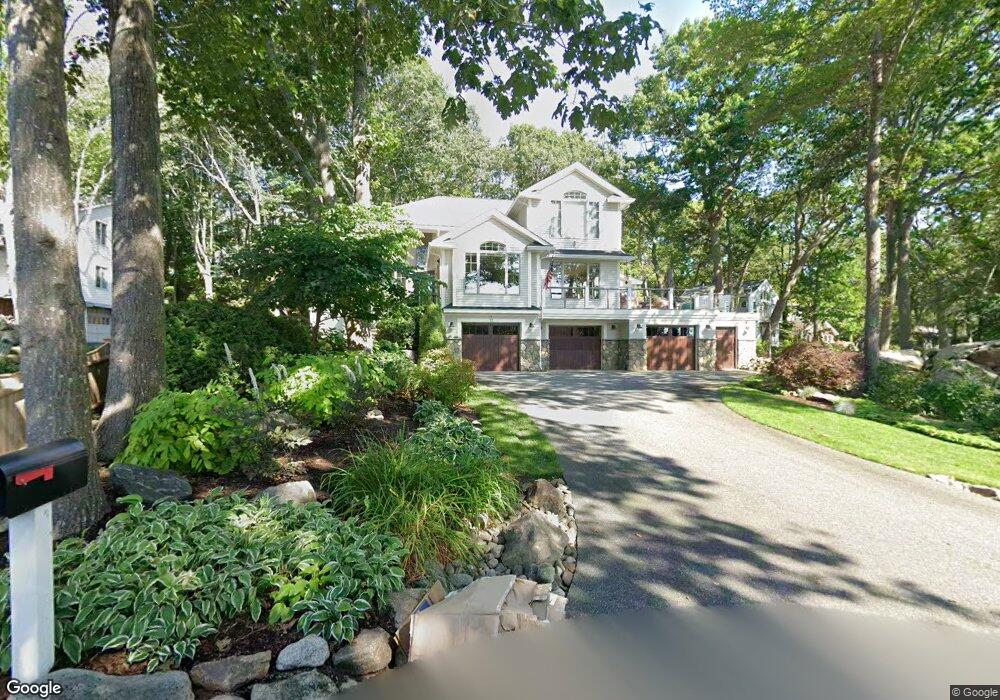
12 Old Salem Path Unit 1 Gloucester, MA 01930
Magnolia NeighborhoodEstimated Value: $1,294,000 - $2,103,000
4
Beds
4
Baths
3,500
Sq Ft
$484/Sq Ft
Est. Value
About This Home
This home is located at 12 Old Salem Path Unit 1, Gloucester, MA 01930 and is currently estimated at $1,694,644, approximately $484 per square foot. 12 Old Salem Path Unit 1 is a home located in Essex County with nearby schools including West Parish, Ralph B O'maley Middle School, and Gloucester High School.
Ownership History
Date
Name
Owned For
Owner Type
Purchase Details
Closed on
Jan 14, 2025
Sold by
Stump Anne M and Stump Paul O
Bought by
Stump 2025 Nt and Stump
Current Estimated Value
Purchase Details
Closed on
Dec 11, 2013
Sold by
Sinclair R S and Stanton Elizabeth
Bought by
Stump Paul O and Stump Anne M
Purchase Details
Closed on
Aug 6, 2009
Sold by
Pappalardo Joseph T
Bought by
Sinclair R Stephen
Purchase Details
Closed on
Apr 7, 2006
Sold by
Popplestone Ledge Rt
Bought by
Pappalardo Joseph T
Purchase Details
Closed on
Dec 1, 1998
Sold by
Pappalardo Joseph T
Bought by
Popplestone Ledge Rt
Create a Home Valuation Report for This Property
The Home Valuation Report is an in-depth analysis detailing your home's value as well as a comparison with similar homes in the area
Home Values in the Area
Average Home Value in this Area
Purchase History
| Date | Buyer | Sale Price | Title Company |
|---|---|---|---|
| Stump 2025 Nt | -- | None Available | |
| Stump 2025 Nt | -- | None Available | |
| Stump 2025 Nt | -- | None Available | |
| Stump Paul O | $875,000 | -- | |
| Sinclair R Stephen | $720,000 | -- | |
| Sinclair R Stephen | $720,000 | -- | |
| Pappalardo Joseph T | -- | -- | |
| Pappalardo Joseph T | -- | -- | |
| Popplestone Ledge Rt | $300,000 | -- | |
| Popplestone Ledge Rt | $300,000 | -- |
Source: Public Records
Mortgage History
| Date | Status | Borrower | Loan Amount |
|---|---|---|---|
| Previous Owner | Popplestone Ledge Rt | $250,000 |
Source: Public Records
Tax History
| Year | Tax Paid | Tax Assessment Tax Assessment Total Assessment is a certain percentage of the fair market value that is determined by local assessors to be the total taxable value of land and additions on the property. | Land | Improvement |
|---|---|---|---|---|
| 2025 | $15,476 | $1,592,200 | $553,100 | $1,039,100 |
| 2024 | $14,457 | $1,485,800 | $527,100 | $958,700 |
| 2023 | $13,497 | $1,274,500 | $470,600 | $803,900 |
| 2022 | $13,030 | $1,110,800 | $409,000 | $701,800 |
| 2021 | $12,578 | $1,011,100 | $371,900 | $639,200 |
| 2020 | $12,606 | $1,022,400 | $350,700 | $671,700 |
| 2019 | $13,237 | $1,043,100 | $350,700 | $692,400 |
| 2018 | $12,498 | $966,600 | $350,700 | $615,900 |
| 2017 | $12,531 | $950,000 | $334,100 | $615,900 |
| 2016 | $12,050 | $885,400 | $316,900 | $568,500 |
| 2015 | $10,912 | $799,400 | $327,900 | $471,500 |
Source: Public Records
Map
Nearby Homes
- 24 Flume Rd
- 2 Ocean Ave Unit 2K
- 53 Raymond St
- 468 Summer St
- 450 Summer St
- 239 Summer St
- 100 Eastern Point Blvd
- 5 Marshfield St
- 5 Lepage Ln
- 24 Cobblestone Ln Unit 603
- 8 Forest St
- 368 Essex Ave
- 145 Essex Ave Unit 402
- 5 Samoset Rd Unit B
- 13 Leslie o Johnson Rd
- 15 Raven Ln Unit 15
- 1 Wonson St
- 33 Middle St
- 15 Harvard St
- 20 Beacon St
- 12 Old Salem Path
- 10 Old Salem Path
- 11 Strawberry Cove
- 13 Old Salem Path
- 13 Strawberry Cove
- 158 Hesperus Ave Unit 3
- 158 Hesperus Ave Unit 2R
- 158 Hesperus Ave Unit 2L
- 158 Hesperus Ave Unit 1
- 158 Hesperus Ave Unit 4
- 8 Old Salem Path
- 11 Old Salem Path
- 9 Strawberry Cove
- 11 Old Salem Rd
- 11 Old Salem Rd
- 160 Hesperus Ave
- 14 Strawberry Cove
- 152 Hesperus Ave
- 6 Old Salem Path
- 9 Old Salem Rd
Your Personal Tour Guide
Ask me questions while you tour the home.