Estimated Value: $516,000 - $544,287
3
Beds
3
Baths
2,117
Sq Ft
$252/Sq Ft
Est. Value
About This Home
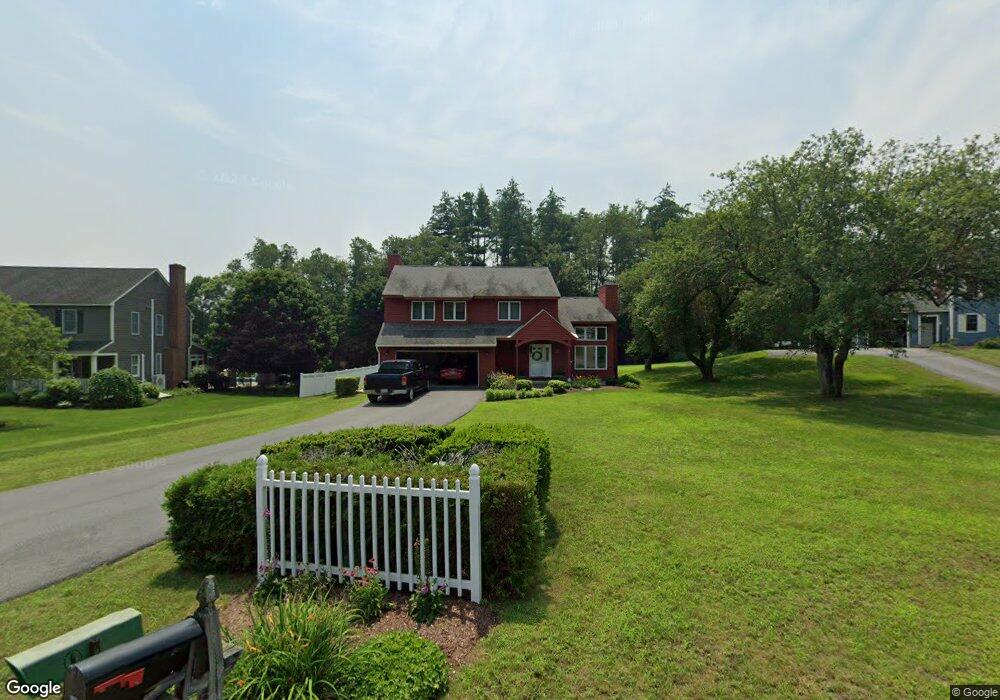
This home is located at 12 Orchard St, Keene, NH 03431 and is currently estimated at $532,822, approximately $251 per square foot. 12 Orchard St is a home with nearby schools including Mount Gilead Elementary School, Symonds Elementary School, and Keene Middle School.
Ownership History
Date
Name
Owned For
Owner Type
Purchase Details
Closed on
Aug 17, 2021
Sold by
Moore Fintan P and Moore Maureen K
Bought by
Moore Ret
Current Estimated Value
Purchase Details
Closed on
Oct 27, 1999
Sold by
Kimbell Stephen L and Kimbell Jeanette L
Bought by
Moore Fintan P and Moore Maureen K
Home Financials for this Owner
Home Financials are based on the most recent Mortgage that was taken out on this home.
Original Mortgage
$100,000
Interest Rate
7.78%
Create a Home Valuation Report for This Property
The Home Valuation Report is an in-depth analysis detailing your home's value as well as a comparison with similar homes in the area
Home Values in the Area
Average Home Value in this Area
Purchase History
| Date | Buyer | Sale Price | Title Company |
|---|---|---|---|
| Moore Ret | -- | None Available | |
| Moore Fintan P | $218,500 | -- |
Source: Public Records
Mortgage History
| Date | Status | Borrower | Loan Amount |
|---|---|---|---|
| Previous Owner | Moore Fintan P | $100,000 |
Source: Public Records
Tax History Compared to Growth
Tax History
| Year | Tax Paid | Tax Assessment Tax Assessment Total Assessment is a certain percentage of the fair market value that is determined by local assessors to be the total taxable value of land and additions on the property. | Land | Improvement |
|---|---|---|---|---|
| 2024 | $11,092 | $335,400 | $54,200 | $281,200 |
| 2023 | $10,696 | $335,400 | $54,200 | $281,200 |
| 2022 | $10,407 | $335,400 | $54,200 | $281,200 |
| 2021 | $10,491 | $335,400 | $54,200 | $281,200 |
| 2020 | $10,732 | $293,900 | $63,000 | $230,900 |
| 2019 | $11,051 | $293,900 | $63,000 | $230,900 |
| 2018 | $10,910 | $293,900 | $63,000 | $230,900 |
| 2017 | $10,939 | $293,900 | $63,000 | $230,900 |
| 2016 | $10,695 | $293,900 | $63,000 | $230,900 |
| 2015 | $11,039 | $320,800 | $72,100 | $248,700 |
Source: Public Records
Map
Nearby Homes
- 110 Arch St Unit 27
- 110 Arch St Unit 42
- 28 Stonehouse Ln
- 18 Stanton Ct
- 38 Stonehouse Ln Unit A
- 8 Tanner Rd
- 257 Park Ave
- 23 Base Hill Rd
- 45 Blossom St
- 15 Stearns Rd
- 7 Newman St
- 106 Pako Ave
- 11 Nut Hatch Ln
- 17 Blue Jay Ct
- 25 Schult St
- 115 Liberty Ln
- 792 Court St Unit A
- 798 Court St Unit G
- 64 Old Walpole Rd
- 184 Kennedy Dr