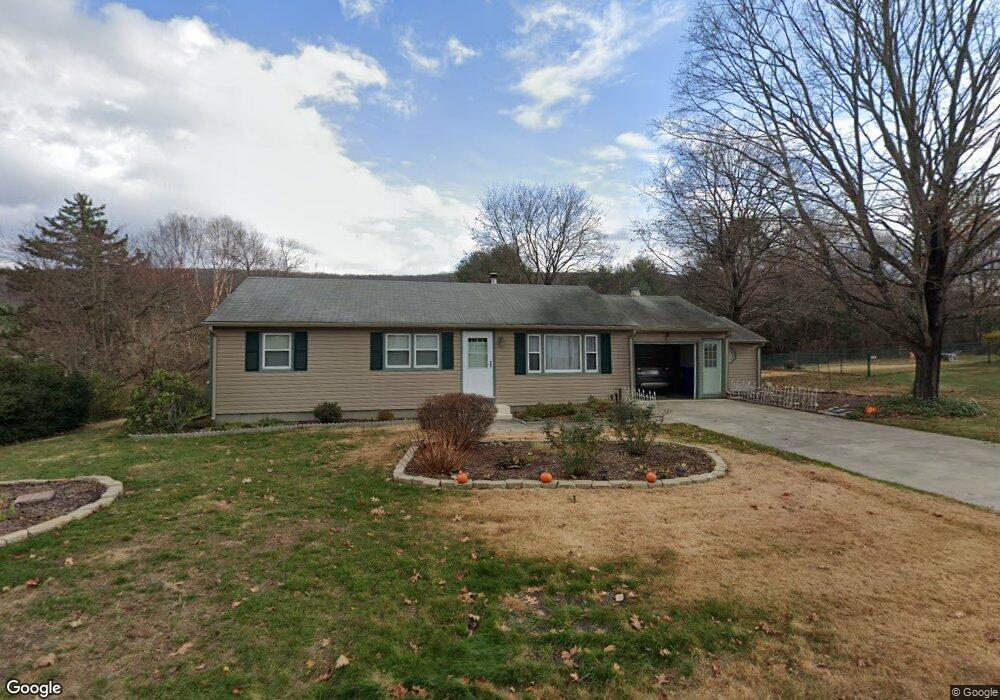
12 Overlook Dr Easthampton, MA 01027
Estimated Value: $436,054 - $510,000
3
Beds
3
Baths
1,508
Sq Ft
$302/Sq Ft
Est. Value
About This Home
This home is located at 12 Overlook Dr, Easthampton, MA 01027 and is currently estimated at $455,764, approximately $302 per square foot. 12 Overlook Dr is a home located in Hampshire County with nearby schools including Easthampton High School, Tri-County Schools, and New England Adolescent Research Institute.
Ownership History
Date
Name
Owned For
Owner Type
Purchase Details
Closed on
Dec 29, 2000
Sold by
Fondakowski Edward J and Fondakowski Marlene M
Bought by
Hurley Arie Elizabeth and Hurley Jeremiah J
Current Estimated Value
Home Financials for this Owner
Home Financials are based on the most recent Mortgage that was taken out on this home.
Original Mortgage
$155,215
Interest Rate
7.7%
Mortgage Type
Purchase Money Mortgage
Create a Home Valuation Report for This Property
The Home Valuation Report is an in-depth analysis detailing your home's value as well as a comparison with similar homes in the area
Home Values in the Area
Average Home Value in this Area
Purchase History
| Date | Buyer | Sale Price | Title Company |
|---|---|---|---|
| Hurley Arie Elizabeth | $156,500 | -- |
Source: Public Records
Mortgage History
| Date | Status | Borrower | Loan Amount |
|---|---|---|---|
| Open | Hurley Arie Elizabeth | $197,455 | |
| Closed | Hurley Arie Elizabeth | $153,500 | |
| Closed | Hurley Arie Elizabeth | $155,215 | |
| Previous Owner | Hurley Arie Elizabeth | $94,000 |
Source: Public Records
Tax History Compared to Growth
Tax History
| Year | Tax Paid | Tax Assessment Tax Assessment Total Assessment is a certain percentage of the fair market value that is determined by local assessors to be the total taxable value of land and additions on the property. | Land | Improvement |
|---|---|---|---|---|
| 2025 | $5,352 | $391,500 | $125,800 | $265,700 |
| 2024 | $5,164 | $380,800 | $121,900 | $258,900 |
| 2023 | $4,062 | $277,300 | $96,000 | $181,300 |
| 2022 | $4,584 | $277,300 | $96,000 | $181,300 |
| 2021 | $5,022 | $286,300 | $96,000 | $190,300 |
| 2020 | $4,925 | $277,300 | $96,000 | $181,300 |
| 2019 | $3,809 | $246,400 | $96,000 | $150,400 |
| 2018 | $3,654 | $228,400 | $90,700 | $137,700 |
| 2017 | $3,565 | $219,900 | $87,000 | $132,900 |
| 2016 | $3,428 | $219,900 | $87,000 | $132,900 |
| 2015 | $3,331 | $219,900 | $87,000 | $132,900 |
Source: Public Records
Map
Nearby Homes