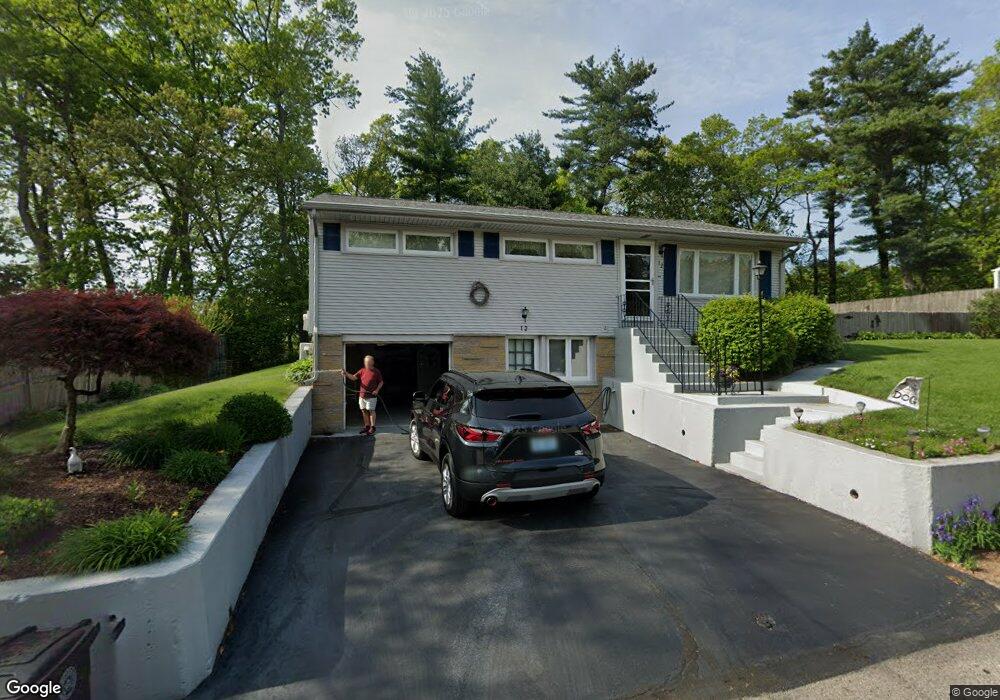
12 Paulette Dr Coventry, RI 02816
Estimated Value: $358,000 - $439,000
3
Beds
1
Bath
960
Sq Ft
$396/Sq Ft
Est. Value
About This Home
This home is located at 12 Paulette Dr, Coventry, RI 02816 and is currently estimated at $380,121, approximately $395 per square foot. 12 Paulette Dr is a home located in Kent County with nearby schools including Alan Shawn Feinstein Ms Of Cov, Coventry High School, and St Joseph School.
Ownership History
Date
Name
Owned For
Owner Type
Purchase Details
Closed on
Aug 2, 2019
Sold by
Ritchotte Ronald P and Ritchotte Lydia
Bought by
Ritchotte Justin
Current Estimated Value
Purchase Details
Closed on
Aug 25, 1989
Sold by
Curry Ernest
Bought by
Ritchotte Roland
Home Financials for this Owner
Home Financials are based on the most recent Mortgage that was taken out on this home.
Original Mortgage
$79,000
Interest Rate
9.67%
Create a Home Valuation Report for This Property
The Home Valuation Report is an in-depth analysis detailing your home's value as well as a comparison with similar homes in the area
Home Values in the Area
Average Home Value in this Area
Purchase History
| Date | Buyer | Sale Price | Title Company |
|---|---|---|---|
| Ritchotte Justin | -- | -- | |
| Ritchotte Roland | $115,000 | -- |
Source: Public Records
Mortgage History
| Date | Status | Borrower | Loan Amount |
|---|---|---|---|
| Previous Owner | Ritchotte Roland | $79,000 |
Source: Public Records
Tax History Compared to Growth
Tax History
| Year | Tax Paid | Tax Assessment Tax Assessment Total Assessment is a certain percentage of the fair market value that is determined by local assessors to be the total taxable value of land and additions on the property. | Land | Improvement |
|---|---|---|---|---|
| 2024 | $3,580 | $226,000 | $78,300 | $147,700 |
| 2023 | $3,465 | $226,000 | $78,300 | $147,700 |
| 2022 | $3,446 | $176,100 | $76,600 | $99,500 |
| 2021 | $3,416 | $176,100 | $76,600 | $99,500 |
| 2020 | $3,916 | $176,100 | $76,600 | $99,500 |
| 2019 | $3,203 | $144,000 | $58,300 | $85,700 |
| 2018 | $3,112 | $144,000 | $58,300 | $85,700 |
| 2017 | $3,021 | $144,000 | $58,300 | $85,700 |
| 2016 | $2,897 | $135,300 | $57,300 | $78,000 |
| 2015 | $2,818 | $135,300 | $57,300 | $78,000 |
| 2014 | $2,576 | $135,300 | $57,300 | $78,000 |
| 2013 | $2,946 | $157,900 | $68,000 | $89,900 |
Source: Public Records
Map
Nearby Homes