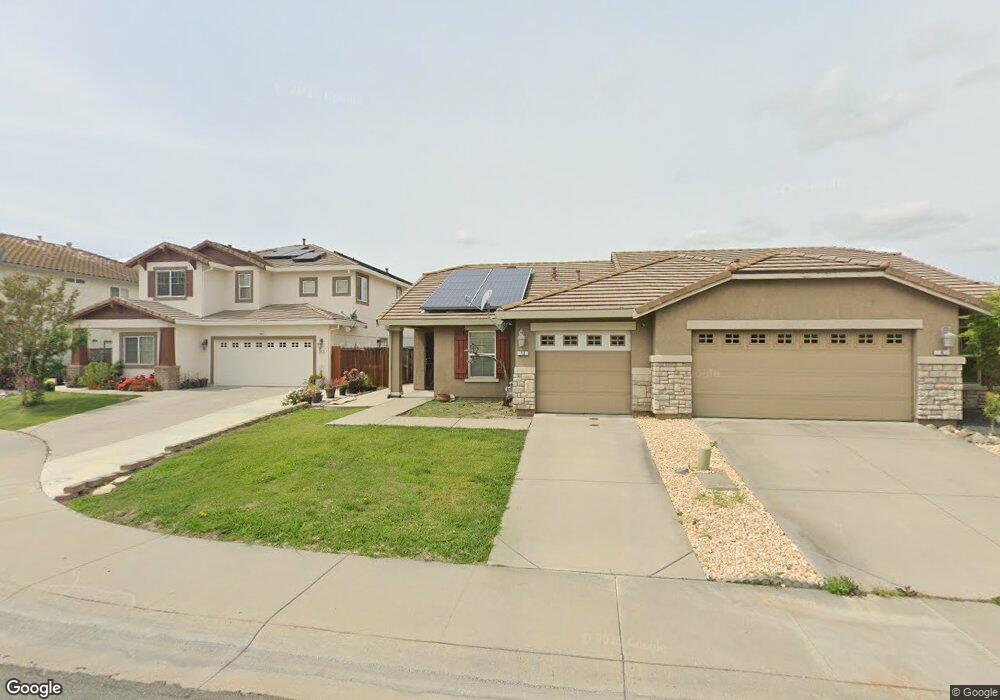
12 Press Ct Elk Grove, CA 95758
North Laguna NeighborhoodEstimated Value: $149,000 - $394,000
2
Beds
1
Bath
936
Sq Ft
$345/Sq Ft
Est. Value
About This Home
This home is located at 12 Press Ct, Elk Grove, CA 95758 and is currently estimated at $323,076, approximately $345 per square foot. 12 Press Ct is a home located in Sacramento County with nearby schools including Irene B. West Elementary School, Edward Harris Jr. Middle School, and Monterey Trail High School.
Ownership History
Date
Name
Owned For
Owner Type
Purchase Details
Closed on
Oct 16, 2017
Sold by
Barclay Porscha and White Porscha
Bought by
Barclay Porscha and Barclay Lamark
Current Estimated Value
Purchase Details
Closed on
May 22, 2009
Sold by
Federal National Mortgage Association
Bought by
White Porscha
Home Financials for this Owner
Home Financials are based on the most recent Mortgage that was taken out on this home.
Original Mortgage
$137,464
Interest Rate
4.8%
Mortgage Type
FHA
Purchase Details
Closed on
Sep 17, 2008
Sold by
Wilson Myisha
Bought by
Fannie Mae and Federal National Mortgage Association
Purchase Details
Closed on
May 29, 2007
Sold by
Centex Homes
Bought by
Wilson Myisha
Home Financials for this Owner
Home Financials are based on the most recent Mortgage that was taken out on this home.
Original Mortgage
$16,580
Interest Rate
6.12%
Mortgage Type
Purchase Money Mortgage
Create a Home Valuation Report for This Property
The Home Valuation Report is an in-depth analysis detailing your home's value as well as a comparison with similar homes in the area
Home Values in the Area
Average Home Value in this Area
Purchase History
| Date | Buyer | Sale Price | Title Company |
|---|---|---|---|
| Barclay Porscha | -- | None Available | |
| White Porscha | $140,000 | Lawyers Title | |
| Fannie Mae | $125,888 | None Available | |
| Wilson Myisha | $166,000 | Commerce Title Company |
Source: Public Records
Mortgage History
| Date | Status | Borrower | Loan Amount |
|---|---|---|---|
| Previous Owner | White Porscha | $137,464 | |
| Previous Owner | White Porscha | $135,075 | |
| Previous Owner | Wilson Myisha | $16,580 |
Source: Public Records
Tax History Compared to Growth
Tax History
| Year | Tax Paid | Tax Assessment Tax Assessment Total Assessment is a certain percentage of the fair market value that is determined by local assessors to be the total taxable value of land and additions on the property. | Land | Improvement |
|---|---|---|---|---|
| 2025 | $2,472 | $180,267 | $70,817 | $109,450 |
| 2024 | $2,472 | $176,733 | $69,429 | $107,304 |
| 2023 | $2,397 | $173,268 | $68,068 | $105,200 |
| 2022 | $2,359 | $169,872 | $66,734 | $103,138 |
| 2021 | $2,314 | $166,542 | $65,426 | $101,116 |
| 2020 | $2,644 | $164,836 | $64,756 | $100,080 |
| 2019 | $2,886 | $161,605 | $63,487 | $98,118 |
| 2018 | $2,164 | $158,438 | $62,243 | $96,195 |
| 2017 | $2,115 | $155,332 | $61,023 | $94,309 |
| 2016 | $2,025 | $152,287 | $59,827 | $92,460 |
| 2015 | $1,978 | $150,001 | $58,929 | $91,072 |
| 2014 | $1,950 | $147,064 | $57,775 | $89,289 |
Source: Public Records
Map
Nearby Homes
- 7515 Sheldon Rd Unit 4103
- 7515 Sheldon Rd Unit 8102
- 7515 Sheldon Rd Unit 7101
- 7515 Sheldon Rd Unit 1101
- 7475 Whitmore St
- 8682 Butterscotch Way
- 7664 Walpole Way
- 8840 Stratham Way
- 8869 Jessup Ct
- 4 Niebaum Ct
- 8527 Dartford Dr
- 229 Bywell Bridge Cir
- 6894 Calvine Rd
- 6880 Calvine Rd
- 6517 Jacinto Ave
- 6451 Jacinto Ave
- 6427 Jacinto Ave
- 8935 Cypress View Way
- 6419 Jacinto Ave
- 6411 Jacinto Ave