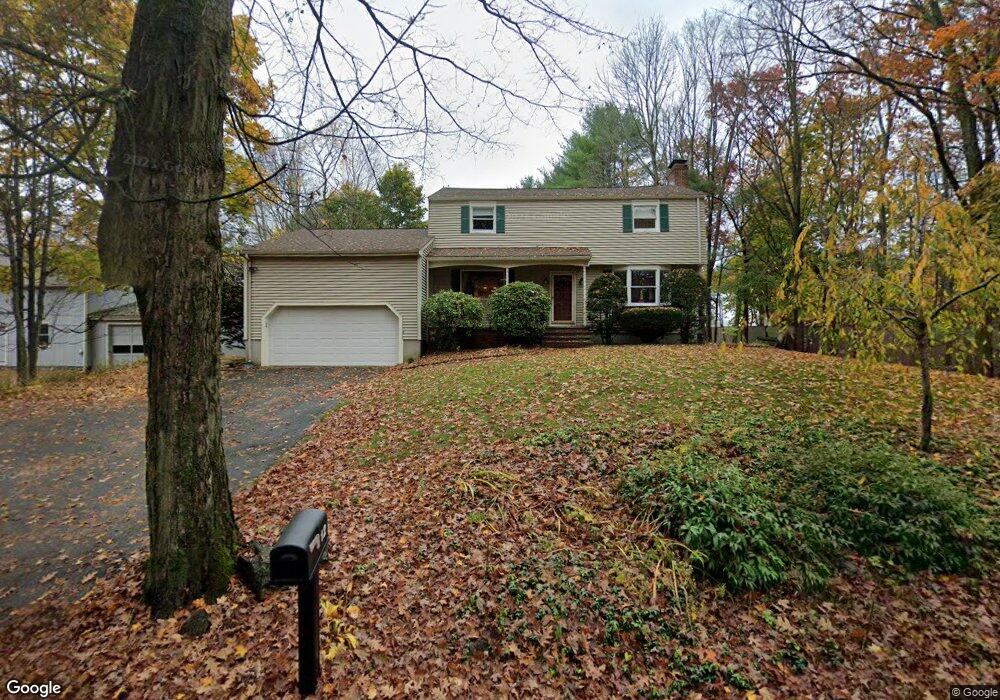
12 Prospect Rd Andover, MA 01810
East Andover NeighborhoodEstimated Value: $842,000 - $980,000
3
Beds
2
Baths
2,491
Sq Ft
$364/Sq Ft
Est. Value
About This Home
This home is located at 12 Prospect Rd, Andover, MA 01810 and is currently estimated at $906,478, approximately $363 per square foot. 12 Prospect Rd is a home located in Essex County with nearby schools including Bancroft Elementary School, Doherty Middle School, and Andover High School.
Ownership History
Date
Name
Owned For
Owner Type
Purchase Details
Closed on
Jun 26, 1998
Sold by
Howland Richard W
Bought by
Dunn Christopher J
Current Estimated Value
Purchase Details
Closed on
Oct 6, 1995
Sold by
Correra Francis X
Bought by
Howland Richard W
Purchase Details
Closed on
May 1, 1991
Sold by
Oleary Peter E
Bought by
Correra Francis X
Create a Home Valuation Report for This Property
The Home Valuation Report is an in-depth analysis detailing your home's value as well as a comparison with similar homes in the area
Home Values in the Area
Average Home Value in this Area
Purchase History
| Date | Buyer | Sale Price | Title Company |
|---|---|---|---|
| Dunn Christopher J | $270,000 | -- | |
| Dunn Christopher J | $270,000 | -- | |
| Howland Richard W | $224,000 | -- | |
| Howland Richard W | $224,000 | -- | |
| Correra Francis X | $179,500 | -- | |
| Correra Francis X | $179,500 | -- |
Source: Public Records
Mortgage History
| Date | Status | Borrower | Loan Amount |
|---|---|---|---|
| Open | Correra Francis X | $30,000 | |
| Open | Correra Francis X | $305,000 |
Source: Public Records
Tax History
| Year | Tax Paid | Tax Assessment Tax Assessment Total Assessment is a certain percentage of the fair market value that is determined by local assessors to be the total taxable value of land and additions on the property. | Land | Improvement |
|---|---|---|---|---|
| 2024 | $9,104 | $706,800 | $359,800 | $347,000 |
| 2023 | $8,740 | $639,800 | $324,000 | $315,800 |
| 2022 | $8,331 | $570,600 | $286,900 | $283,700 |
| 2021 | $8,010 | $523,900 | $260,800 | $263,100 |
| 2020 | $7,718 | $514,200 | $254,600 | $259,600 |
| 2019 | $7,572 | $495,900 | $240,000 | $255,900 |
| 2018 | $7,254 | $463,800 | $226,500 | $237,300 |
| 2017 | $6,921 | $455,900 | $221,900 | $234,000 |
| 2016 | $6,574 | $443,600 | $207,700 | $235,900 |
| 2015 | $6,343 | $423,700 | $199,700 | $224,000 |
Source: Public Records
Map
Nearby Homes
- 133B Salem
- 57 Salem St
- 52 Salem St
- 49 Salem St
- 16 Porter Rd
- 4 Hammond Way
- 31 Porter Rd
- 154 Main St
- 344 S Main St
- 81 Chestnut St Unit 81
- 100.5 Main St Unit Q
- 3 Seten Cir
- 1 Stratford Rd
- 96 N Main St Unit 3
- 56 Sunset Rock Rd
- 33 Chestnut St Unit 2
- 46 Whittier St
- 56 Central St
- 23 Belknap Dr
- 3 West Hollow
Your Personal Tour Guide
Ask me questions while you tour the home.