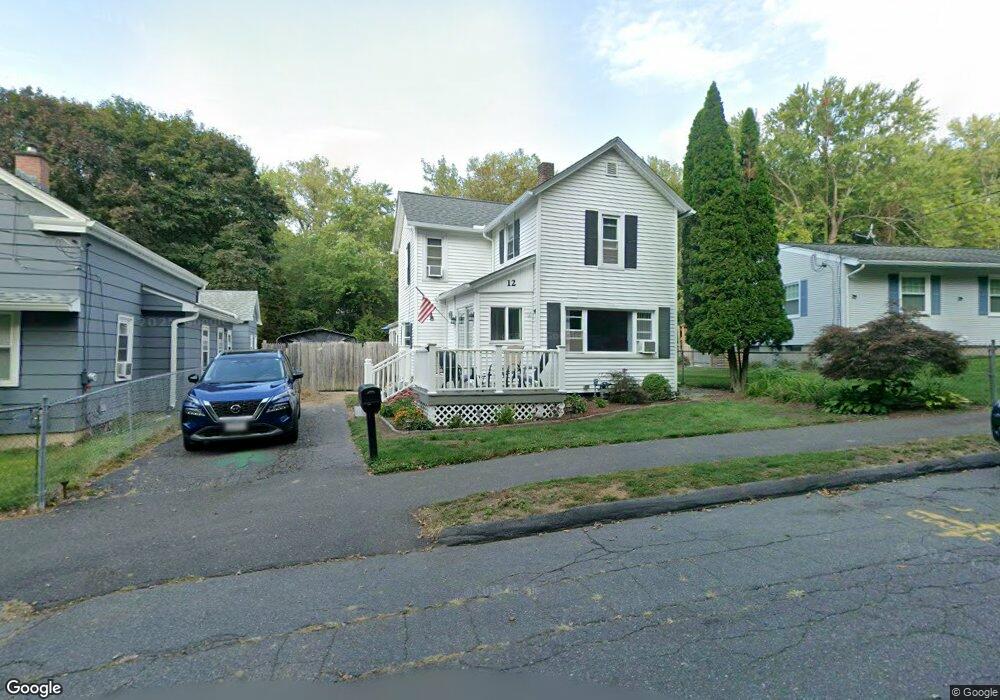
12 Prospect St South Hadley, MA 01075
Estimated Value: $301,000 - $337,000
3
Beds
1
Bath
1,386
Sq Ft
$230/Sq Ft
Est. Value
About This Home
This home is located at 12 Prospect St, South Hadley, MA 01075 and is currently estimated at $318,511, approximately $229 per square foot. 12 Prospect St is a home located in Hampshire County with nearby schools including Plains Elementary School, Mosier Elementary School, and Michael E. Smith Middle School.
Ownership History
Date
Name
Owned For
Owner Type
Purchase Details
Closed on
Apr 5, 1994
Sold by
Marchand Ft and Marchand Nancy A
Bought by
Mantjak Evelyn M and Mantjak Michael E
Current Estimated Value
Purchase Details
Closed on
Mar 31, 1993
Sold by
Cabot Mgmt Corp
Bought by
Marchand Constr Co Inc and Kotarba Linda J
Create a Home Valuation Report for This Property
The Home Valuation Report is an in-depth analysis detailing your home's value as well as a comparison with similar homes in the area
Home Values in the Area
Average Home Value in this Area
Purchase History
| Date | Buyer | Sale Price | Title Company |
|---|---|---|---|
| Mantjak Evelyn M | $88,600 | -- | |
| Marchand Constr Co Inc | $60,000 | -- |
Source: Public Records
Mortgage History
| Date | Status | Borrower | Loan Amount |
|---|---|---|---|
| Open | Marchand Constr Co Inc | $40,463 | |
| Open | Marchand Constr Co Inc | $135,616 | |
| Closed | Marchand Constr Co Inc | $25,410 |
Source: Public Records
Tax History Compared to Growth
Tax History
| Year | Tax Paid | Tax Assessment Tax Assessment Total Assessment is a certain percentage of the fair market value that is determined by local assessors to be the total taxable value of land and additions on the property. | Land | Improvement |
|---|---|---|---|---|
| 2025 | $3,616 | $227,000 | $76,600 | $150,400 |
| 2024 | $3,713 | $223,000 | $71,500 | $151,500 |
| 2023 | $3,705 | $211,100 | $65,100 | $146,000 |
| 2022 | $3,533 | $191,200 | $65,100 | $126,100 |
| 2021 | $3,485 | $179,100 | $60,700 | $118,400 |
| 2020 | $3,334 | $167,200 | $60,700 | $106,500 |
| 2019 | $3,331 | $165,300 | $57,800 | $107,500 |
| 2018 | $3,195 | $160,300 | $56,100 | $104,200 |
| 2017 | $3,072 | $152,700 | $56,100 | $96,600 |
| 2016 | $3,011 | $151,700 | $56,100 | $95,600 |
| 2015 | $2,857 | $147,400 | $54,500 | $92,900 |
Source: Public Records
Map
Nearby Homes
- 49 N Main St
- 27 Bardwell St Unit 4
- 70 Lathrop St
- 32 North St
- 41 W Summit St Unit 72
- 41 W Summit St Unit 54
- 41 W Summit St Unit 32
- 41 W Summit St Unit 55
- 7 Hunter Terrace
- 84 Judd Ave
- 318 Newton St
- 47 Pynchon Rd
- 2 Arbor Way Unit C
- 3 Ralph Ave
- 133 Granby Rd
- 48 N Canal St
- 45 Shadow Brook Estate
- 75 Elm St
- 87 Pine St
- 20 Linden St