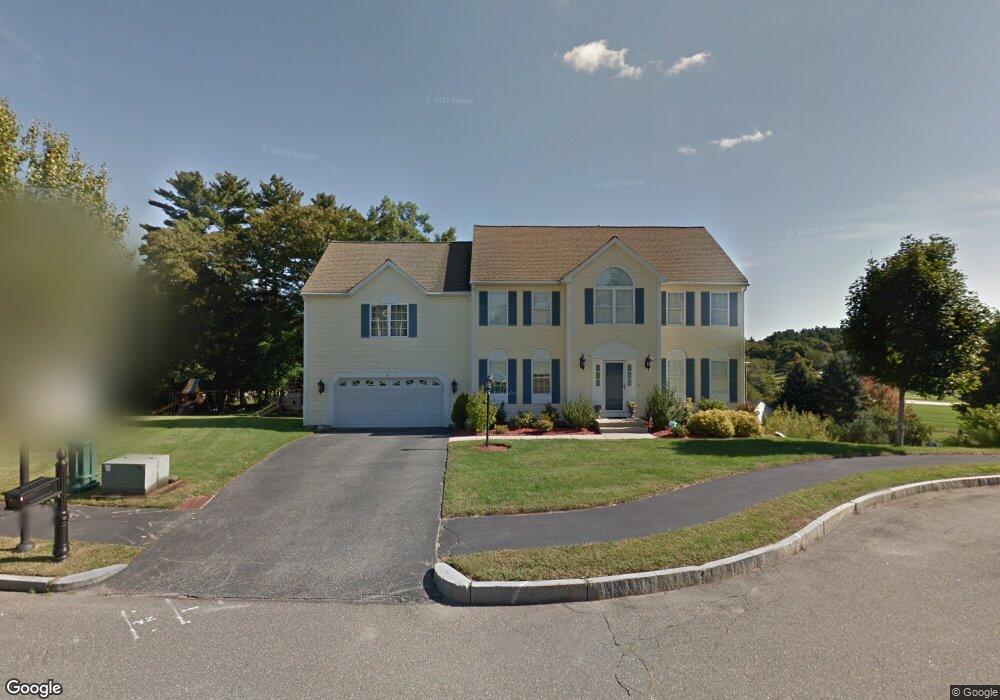
12 Quail Run Wakefield, MA 01880
Woodville NeighborhoodEstimated Value: $1,228,595 - $1,410,000
4
Beds
3
Baths
3,203
Sq Ft
$419/Sq Ft
Est. Value
About This Home
This home is located at 12 Quail Run, Wakefield, MA 01880 and is currently estimated at $1,341,899, approximately $418 per square foot. 12 Quail Run is a home located in Middlesex County with nearby schools including Wakefield Memorial High School, St Joseph School, and Odyssey Day School.
Ownership History
Date
Name
Owned For
Owner Type
Purchase Details
Closed on
May 4, 2011
Sold by
Joly James J and Joly Doreen M
Bought by
Farber Scott J and Farber Leigh M
Current Estimated Value
Home Financials for this Owner
Home Financials are based on the most recent Mortgage that was taken out on this home.
Original Mortgage
$500,000
Outstanding Balance
$345,277
Interest Rate
4.82%
Mortgage Type
Purchase Money Mortgage
Estimated Equity
$996,622
Purchase Details
Closed on
Jun 14, 1999
Sold by
Land Merchants Inc
Bought by
Joly James J and Joly Doreen M
Home Financials for this Owner
Home Financials are based on the most recent Mortgage that was taken out on this home.
Original Mortgage
$382,612
Interest Rate
6.9%
Mortgage Type
Purchase Money Mortgage
Create a Home Valuation Report for This Property
The Home Valuation Report is an in-depth analysis detailing your home's value as well as a comparison with similar homes in the area
Home Values in the Area
Average Home Value in this Area
Purchase History
| Date | Buyer | Sale Price | Title Company |
|---|---|---|---|
| Farber Scott J | $625,000 | -- | |
| Joly James J | $402,000 | -- |
Source: Public Records
Mortgage History
| Date | Status | Borrower | Loan Amount |
|---|---|---|---|
| Open | Farber Scott J | $500,000 | |
| Previous Owner | Joly James J | $382,612 |
Source: Public Records
Tax History Compared to Growth
Tax History
| Year | Tax Paid | Tax Assessment Tax Assessment Total Assessment is a certain percentage of the fair market value that is determined by local assessors to be the total taxable value of land and additions on the property. | Land | Improvement |
|---|---|---|---|---|
| 2025 | $11,508 | $1,013,900 | $349,900 | $664,000 |
| 2024 | $11,205 | $996,000 | $343,700 | $652,300 |
| 2023 | $11,265 | $960,400 | $331,400 | $629,000 |
| 2022 | $10,956 | $889,300 | $306,900 | $582,400 |
| 2021 | $10,297 | $808,900 | $260,200 | $548,700 |
| 2020 | $9,804 | $767,700 | $246,900 | $520,800 |
| 2019 | $9,234 | $719,700 | $231,500 | $488,200 |
| 2018 | $8,965 | $692,300 | $222,700 | $469,600 |
| 2017 | $8,932 | $685,500 | $220,500 | $465,000 |
| 2016 | $8,383 | $621,400 | $210,800 | $410,600 |
| 2015 | $7,903 | $586,300 | $198,900 | $387,400 |
| 2014 | $7,493 | $586,300 | $198,900 | $387,400 |
Source: Public Records
Map
Nearby Homes
- 8 Everett St
- 9 Lilah Cir
- 199 Nahant St
- 1 Millbrook Ln Unit 111
- 1 Millbrook Ln Unit 304
- 70 Old Nahant Rd
- 134 Nahant St Unit B
- 6 Salisbury Rd
- 14 Sycamore Rd
- 6 Castle Clare Cir
- 5 Bateman Ct Unit 5
- 314 Water St Unit 5
- 38 Bennett St Unit 3D
- 18 Crosby Rd
- 6 Blue Jay Cir Unit 2
- 1 Sidney St
- 22 Jefferson Rd
- 95 Greenwood Ave
- 762 Main St
- 772 Main St Unit 2