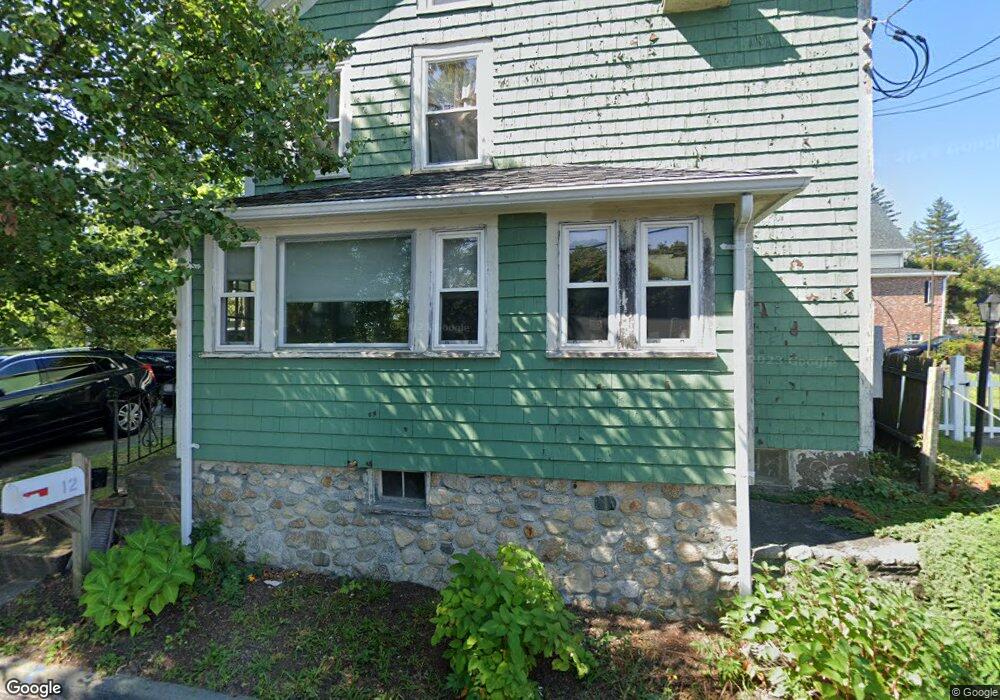
12 Quinlan St Milford, MA 01757
Estimated Value: $384,746 - $452,000
3
Beds
1
Bath
1,463
Sq Ft
$287/Sq Ft
Est. Value
About This Home
This home is located at 12 Quinlan St, Milford, MA 01757 and is currently estimated at $419,937, approximately $287 per square foot. 12 Quinlan St is a home located in Worcester County with nearby schools including Milford High School and Bethany Christian Academy.
Ownership History
Date
Name
Owned For
Owner Type
Purchase Details
Closed on
Mar 23, 2022
Sold by
Macescsko Kristine
Bought by
Capstick Patrick J
Current Estimated Value
Purchase Details
Closed on
Jun 5, 2019
Sold by
Capstick Patrick J
Bought by
Capstick Patrick J and Macecsko Kristine
Purchase Details
Closed on
Feb 11, 2004
Sold by
Capstick Patrick J and Capstick Sue Ellen
Bought by
Capstick Patrick J
Purchase Details
Closed on
Aug 25, 1988
Sold by
Mcgrath Angela M
Bought by
Capstick Patrick J
Home Financials for this Owner
Home Financials are based on the most recent Mortgage that was taken out on this home.
Original Mortgage
$90,000
Interest Rate
10.36%
Mortgage Type
Purchase Money Mortgage
Create a Home Valuation Report for This Property
The Home Valuation Report is an in-depth analysis detailing your home's value as well as a comparison with similar homes in the area
Home Values in the Area
Average Home Value in this Area
Purchase History
| Date | Buyer | Sale Price | Title Company |
|---|---|---|---|
| Capstick Patrick J | -- | None Available | |
| Capstick Patrick J | -- | -- | |
| Capstick Patrick J | -- | -- | |
| Capstick Patrick J | $112,500 | -- |
Source: Public Records
Mortgage History
| Date | Status | Borrower | Loan Amount |
|---|---|---|---|
| Previous Owner | Capstick Patrick J | $90,000 |
Source: Public Records
Tax History
| Year | Tax Paid | Tax Assessment Tax Assessment Total Assessment is a certain percentage of the fair market value that is determined by local assessors to be the total taxable value of land and additions on the property. | Land | Improvement |
|---|---|---|---|---|
| 2025 | $4,168 | $325,600 | $134,100 | $191,500 |
| 2024 | $3,990 | $300,200 | $127,800 | $172,400 |
| 2023 | $3,900 | $269,900 | $107,600 | $162,300 |
| 2022 | $3,812 | $247,700 | $98,200 | $149,500 |
| 2021 | $6,095 | $221,700 | $98,200 | $123,500 |
| 2020 | $3,498 | $219,200 | $98,200 | $121,000 |
| 2019 | $5,826 | $191,200 | $98,200 | $93,000 |
| 2018 | $3,088 | $186,500 | $93,500 | $93,000 |
| 2017 | $3,895 | $174,500 | $93,500 | $81,000 |
| 2016 | $2,735 | $159,200 | $84,200 | $75,000 |
| 2015 | $2,706 | $154,200 | $81,100 | $73,100 |
Source: Public Records
Map
Nearby Homes
Your Personal Tour Guide
Ask me questions while you tour the home.