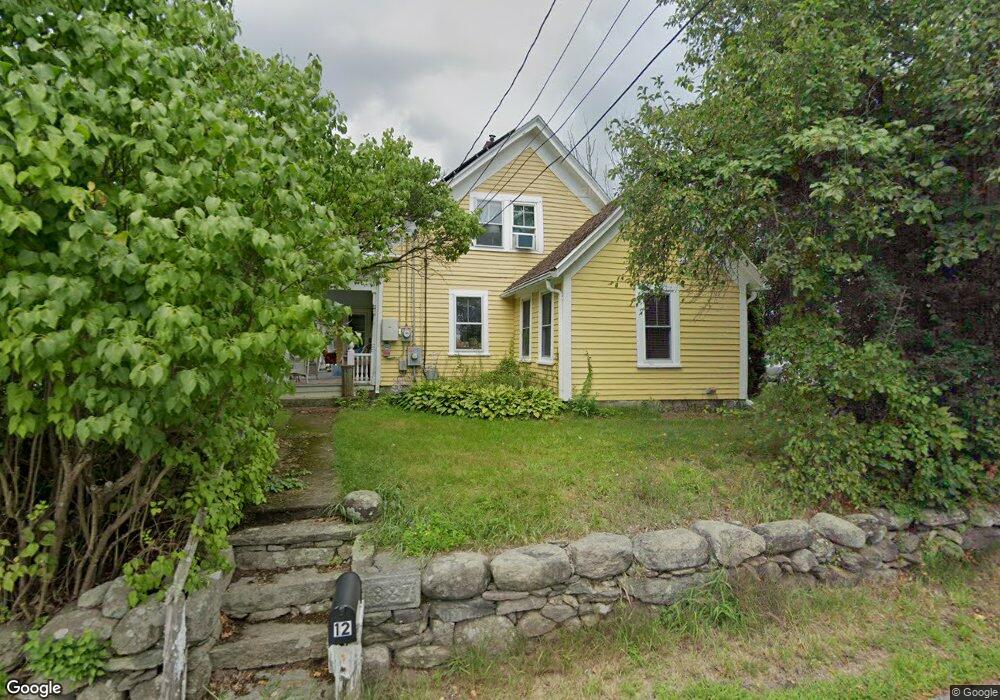
12 Rhodes St Cumberland, RI 02864
North Cumberland NeighborhoodEstimated Value: $695,087 - $971,000
5
Beds
3
Baths
2,861
Sq Ft
$307/Sq Ft
Est. Value
About This Home
This home is located at 12 Rhodes St, Cumberland, RI 02864 and is currently estimated at $877,772, approximately $306 per square foot. 12 Rhodes St is a home located in Providence County with nearby schools including Community School, North Cumberland Middle School, and Cumberland High School.
Ownership History
Date
Name
Owned For
Owner Type
Purchase Details
Closed on
May 3, 2024
Sold by
Gagne Ft and Lyons
Bought by
Gagne Paul W and Gagne Diane M
Current Estimated Value
Home Financials for this Owner
Home Financials are based on the most recent Mortgage that was taken out on this home.
Original Mortgage
$110,000
Outstanding Balance
$105,945
Interest Rate
6.87%
Mortgage Type
Stand Alone Refi Refinance Of Original Loan
Estimated Equity
$771,827
Purchase Details
Closed on
Dec 14, 2023
Sold by
Gagne Paul W and Gagne Diane M
Bought by
Gagne Ft and Gagne
Purchase Details
Closed on
Jun 23, 2004
Sold by
Ensom Laura
Bought by
Gagne Paul W
Purchase Details
Closed on
Jun 26, 2001
Sold by
Rice Robert Evans
Bought by
Ensom Peter G and Ensom Laura J
Create a Home Valuation Report for This Property
The Home Valuation Report is an in-depth analysis detailing your home's value as well as a comparison with similar homes in the area
Home Values in the Area
Average Home Value in this Area
Purchase History
| Date | Buyer | Sale Price | Title Company |
|---|---|---|---|
| Gagne Paul W | -- | None Available | |
| Gagne Paul W | -- | None Available | |
| Gagne Ft | -- | None Available | |
| Gagne Ft | -- | None Available | |
| Gagne Paul W | $460,000 | -- | |
| Gagne Paul W | $460,000 | -- | |
| Ensom Peter G | $350,000 | -- | |
| Ensom Peter G | $350,000 | -- |
Source: Public Records
Mortgage History
| Date | Status | Borrower | Loan Amount |
|---|---|---|---|
| Open | Gagne Paul W | $110,000 | |
| Closed | Gagne Paul W | $110,000 | |
| Previous Owner | Ensom Peter G | $266,900 | |
| Previous Owner | Ensom Peter G | $100,000 | |
| Previous Owner | Ensom Peter G | $307,500 |
Source: Public Records
Tax History Compared to Growth
Tax History
| Year | Tax Paid | Tax Assessment Tax Assessment Total Assessment is a certain percentage of the fair market value that is determined by local assessors to be the total taxable value of land and additions on the property. | Land | Improvement |
|---|---|---|---|---|
| 2025 | $5,983 | $487,600 | $183,500 | $304,100 |
| 2024 | $5,827 | $487,600 | $183,500 | $304,100 |
| 2023 | $5,645 | $485,800 | $183,500 | $302,300 |
| 2022 | $5,473 | $365,100 | $143,900 | $221,200 |
| 2021 | $5,382 | $365,100 | $143,900 | $221,200 |
| 2020 | $5,228 | $365,100 | $143,900 | $221,200 |
| 2019 | $5,252 | $330,700 | $131,300 | $199,400 |
| 2018 | $5,099 | $330,700 | $131,300 | $199,400 |
| 2017 | $5,030 | $330,700 | $131,300 | $199,400 |
| 2016 | $5,283 | $309,300 | $133,300 | $176,000 |
| 2015 | $5,283 | $309,300 | $133,300 | $176,000 |
| 2014 | $5,283 | $309,300 | $133,300 | $176,000 |
| 2013 | $5,641 | $357,500 | $135,300 | $222,200 |
Source: Public Records
Map
Nearby Homes