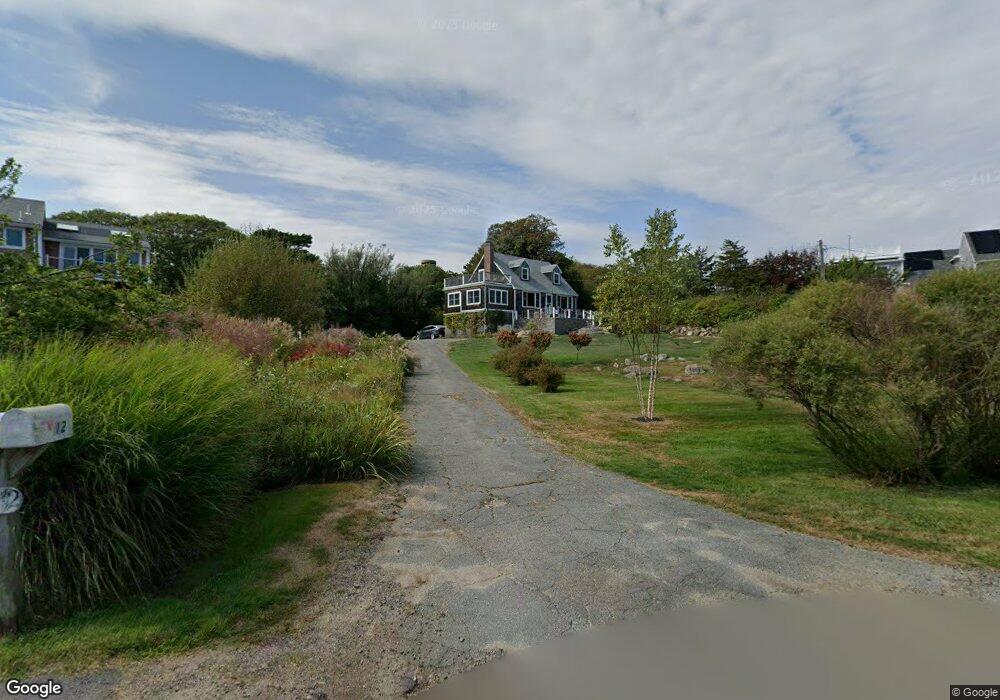
12 Ruthern Way Rockport, MA 01966
Estimated Value: $1,086,437 - $1,224,000
3
Beds
2
Baths
1,799
Sq Ft
$649/Sq Ft
Est. Value
About This Home
This home is located at 12 Ruthern Way, Rockport, MA 01966 and is currently estimated at $1,167,109, approximately $648 per square foot. 12 Ruthern Way is a home located in Essex County with nearby schools including Rockport Elementary School, Rockport Middle School, and Rockport High School.
Ownership History
Date
Name
Owned For
Owner Type
Purchase Details
Closed on
Mar 1, 2023
Sold by
Narkewicz David J
Bought by
J Narkewicz T D
Current Estimated Value
Purchase Details
Closed on
May 24, 2004
Sold by
Muzio Frank P and Muzio Jeanne
Bought by
Narkewicz David J
Purchase Details
Closed on
Nov 3, 1998
Sold by
Bradford Helen P Est and Bradford George L
Bought by
Muzio Frank P and Muzio Jeanne
Create a Home Valuation Report for This Property
The Home Valuation Report is an in-depth analysis detailing your home's value as well as a comparison with similar homes in the area
Home Values in the Area
Average Home Value in this Area
Purchase History
| Date | Buyer | Sale Price | Title Company |
|---|---|---|---|
| J Narkewicz T D | -- | None Available | |
| J Narkewicz T D | -- | None Available | |
| J Narkewicz T D | -- | None Available | |
| Narkewicz David J | $796,000 | -- | |
| Narkewicz David J | $796,000 | -- | |
| Muzio Frank P | $329,000 | -- | |
| Muzio Frank P | $329,000 | -- |
Source: Public Records
Mortgage History
| Date | Status | Borrower | Loan Amount |
|---|---|---|---|
| Previous Owner | Muzio Frank P | $343,500 | |
| Previous Owner | Muzio Frank P | $417,000 |
Source: Public Records
Tax History Compared to Growth
Tax History
| Year | Tax Paid | Tax Assessment Tax Assessment Total Assessment is a certain percentage of the fair market value that is determined by local assessors to be the total taxable value of land and additions on the property. | Land | Improvement |
|---|---|---|---|---|
| 2025 | $8,750 | $998,900 | $512,900 | $486,000 |
| 2024 | $8,313 | $987,300 | $501,300 | $486,000 |
| 2023 | $7,558 | $801,500 | $419,700 | $381,800 |
| 2022 | $7,170 | $730,100 | $385,600 | $344,500 |
| 2021 | $6,777 | $695,800 | $367,100 | $328,700 |
| 2020 | $6,708 | $664,200 | $413,100 | $251,100 |
| 2019 | $6,478 | $657,000 | $413,400 | $243,600 |
| 2018 | $6,304 | $623,500 | $385,900 | $237,600 |
| 2017 | $6,267 | $555,600 | $350,000 | $205,600 |
| 2016 | $6,332 | $562,800 | $352,200 | $210,600 |
| 2015 | $5,983 | $543,900 | $340,000 | $203,900 |
| 2014 | $5,797 | $514,400 | $315,700 | $198,700 |
Source: Public Records
Map
Nearby Homes
- 48 Eden Rd
- 33 Highview Rd
- 1 Arens Rd
- 34R Summer St
- 57 Mt Pleasant St Unit 2B
- 5 Marshall Ln
- 4 Norwood Ave
- 2 Mount Pleasant St Unit 3
- 27 Hodgkins Rd
- 20 Railroad Ave
- 5 Smith St Unit R
- 15 Granite St
- 18 Granite St
- 13 Rowe Point
- 2 Boulder Top
- 26 Marina Dr
- 165 Granite St
- 29 Harrison Ave
- 10 Amero Ct
- 20 Haskell St