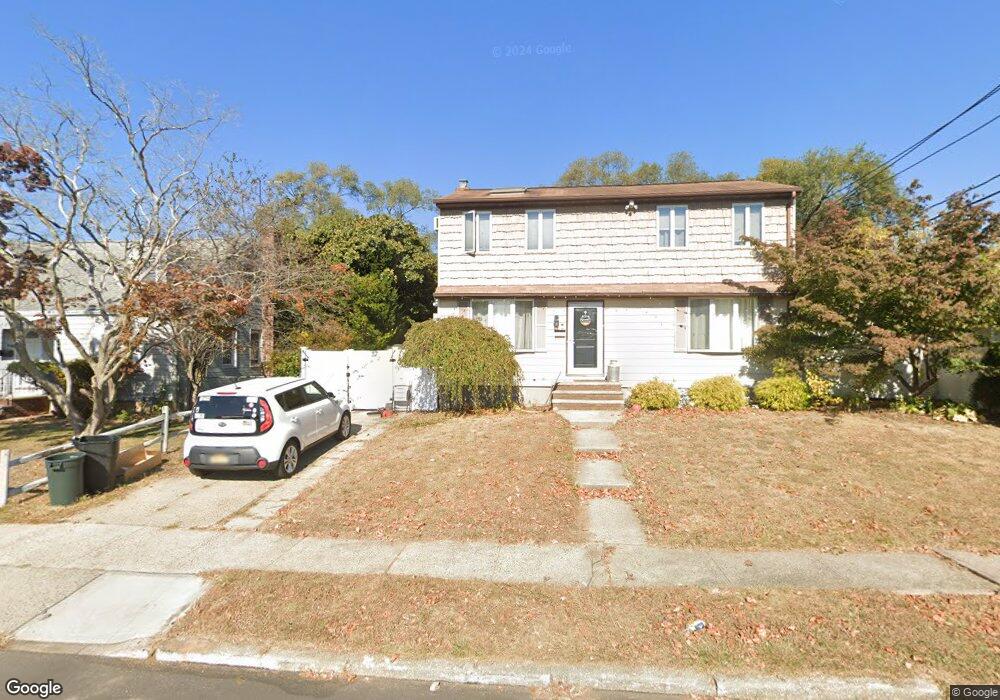
12 Sherman Place Bethpage, NY 11714
Estimated Value: $790,047 - $837,000
4
Beds
2
Baths
1,548
Sq Ft
$526/Sq Ft
Est. Value
About This Home
This home is located at 12 Sherman Place, Bethpage, NY 11714 and is currently estimated at $813,524, approximately $525 per square foot. 12 Sherman Place is a home located in Nassau County with nearby schools including Michael F. Stokes Elementary School, J Fred Sparke Elementary School, and Island Trees Middle School.
Ownership History
Date
Name
Owned For
Owner Type
Purchase Details
Closed on
Oct 22, 2013
Sold by
Zakaria Taimur and The Taimur Zakaria Loving Trus
Bought by
Ciccione Anthony and Ciccione Nicole
Current Estimated Value
Home Financials for this Owner
Home Financials are based on the most recent Mortgage that was taken out on this home.
Original Mortgage
$383,300
Outstanding Balance
$286,447
Interest Rate
4.36%
Estimated Equity
$527,077
Purchase Details
Closed on
Oct 28, 2008
Sold by
Zakaria Taimur and Zakaria Deea
Bought by
Zakaria Taimur and Taimur Zakaria Loving Trust
Purchase Details
Closed on
Oct 7, 2003
Sold by
Zakaria Taimur
Purchase Details
Closed on
Nov 9, 1998
Purchase Details
Closed on
Nov 17, 1997
Sold by
Stegeman Edward J
Bought by
Taimur Zakaria and Deisa Zakaria
Create a Home Valuation Report for This Property
The Home Valuation Report is an in-depth analysis detailing your home's value as well as a comparison with similar homes in the area
Home Values in the Area
Average Home Value in this Area
Purchase History
| Date | Buyer | Sale Price | Title Company |
|---|---|---|---|
| Ciccione Anthony | $403,500 | Ram Abstract Ltd As Agent Fo | |
| Zakaria Taimur | -- | None Available | |
| -- | -- | -- | |
| -- | -- | -- | |
| Taimur Zakaria | $183,000 | -- |
Source: Public Records
Mortgage History
| Date | Status | Borrower | Loan Amount |
|---|---|---|---|
| Open | Ciccione Anthony | $383,300 |
Source: Public Records
Tax History Compared to Growth
Tax History
| Year | Tax Paid | Tax Assessment Tax Assessment Total Assessment is a certain percentage of the fair market value that is determined by local assessors to be the total taxable value of land and additions on the property. | Land | Improvement |
|---|---|---|---|---|
| 2025 | $12,675 | $508 | $219 | $289 |
| 2024 | $4,431 | $493 | $213 | $280 |
| 2023 | $11,747 | $494 | $219 | $275 |
| 2022 | $11,747 | $494 | $219 | $275 |
| 2021 | $15,147 | $471 | $209 | $262 |
| 2020 | $10,520 | $566 | $448 | $118 |
| 2019 | $9,400 | $566 | $397 | $169 |
| 2018 | $7,679 | $566 | $0 | $0 |
| 2017 | $4,717 | $638 | $402 | $236 |
| 2016 | $7,796 | $693 | $429 | $264 |
| 2015 | $3,079 | $711 | $441 | $270 |
| 2014 | $3,079 | $711 | $441 | $270 |
| 2013 | $2,904 | $723 | $448 | $275 |
Source: Public Records
Map
Nearby Homes
- 307- 13 Hicksville Rd Unit 13
- 253 Hicksville Rd Unit 2K
- 3680 Stokes Ave
- 12 Carson St
- 43 Farmedge Rd
- 15 Hewmann Place
- 472 Farmranch Rd E
- 4030 Avoca Ave
- 149 Cardinal Rd
- 111 Michael Place
- 15 Scherer St
- 107 Cardinal Rd
- 38 Bradford Ln
- 34 Scherer St
- 3562 Raven St
- 15 N Butehorn St
- 47 Cardinal Rd
- 26 Bradford Ln
- 464 Central Ave
- 3520 Mallard Rd