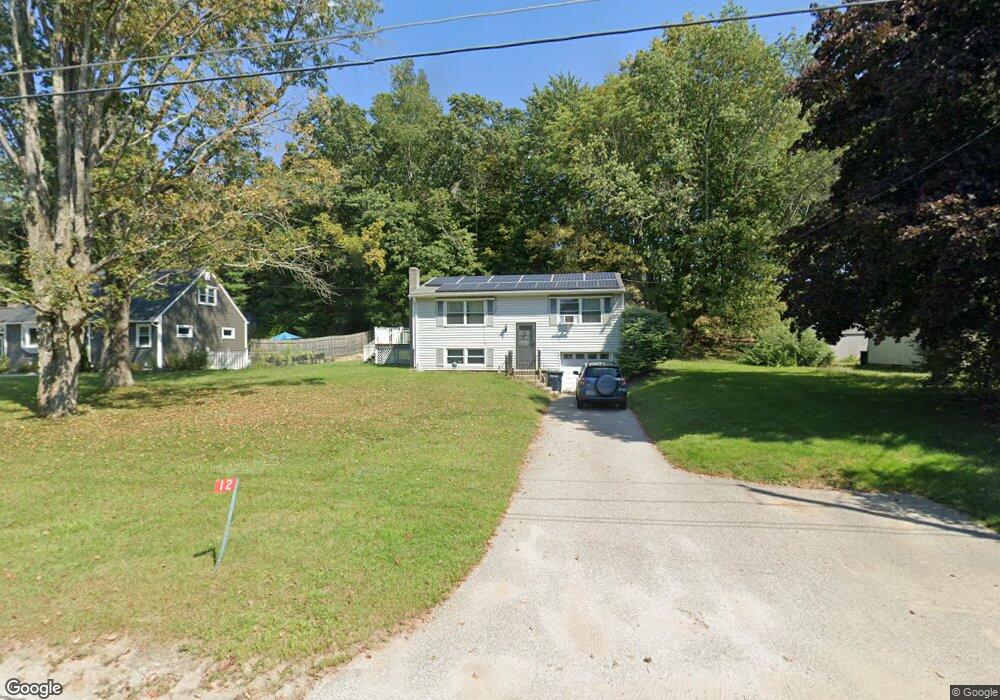
12 Snell St Sturbridge, MA 01518
Estimated Value: $257,000 - $409,000
2
Beds
3
Baths
816
Sq Ft
$391/Sq Ft
Est. Value
About This Home
This home is located at 12 Snell St, Sturbridge, MA 01518 and is currently estimated at $319,450, approximately $391 per square foot. 12 Snell St is a home located in Worcester County with nearby schools including Burgess Elementary School, Tantasqua Regional Junior High School, and Tantasqua Regional High School.
Ownership History
Date
Name
Owned For
Owner Type
Purchase Details
Closed on
May 9, 1994
Sold by
Everett Allen R and Everett Anna
Bought by
Boiteau Wayne and Boiteau Barbara
Current Estimated Value
Home Financials for this Owner
Home Financials are based on the most recent Mortgage that was taken out on this home.
Original Mortgage
$98,800
Interest Rate
7.7%
Mortgage Type
Purchase Money Mortgage
Create a Home Valuation Report for This Property
The Home Valuation Report is an in-depth analysis detailing your home's value as well as a comparison with similar homes in the area
Home Values in the Area
Average Home Value in this Area
Purchase History
| Date | Buyer | Sale Price | Title Company |
|---|---|---|---|
| Boiteau Wayne | $96,900 | -- |
Source: Public Records
Mortgage History
| Date | Status | Borrower | Loan Amount |
|---|---|---|---|
| Open | Boiteau Wayne | $64,036 | |
| Closed | Boiteau Wayne | $35,000 | |
| Closed | Boiteau Wayne | $98,800 | |
| Previous Owner | Boiteau Wayne | $80,000 |
Source: Public Records
Tax History
| Year | Tax Paid | Tax Assessment Tax Assessment Total Assessment is a certain percentage of the fair market value that is determined by local assessors to be the total taxable value of land and additions on the property. | Land | Improvement |
|---|---|---|---|---|
| 2025 | $3,775 | $237,000 | $68,700 | $168,300 |
| 2024 | $3,643 | $220,900 | $67,300 | $153,600 |
| 2023 | $3,450 | $190,900 | $58,900 | $132,000 |
| 2022 | $3,326 | $173,700 | $53,700 | $120,000 |
| 2021 | $2,944 | $154,800 | $51,200 | $103,600 |
| 2020 | $2,944 | $154,800 | $51,200 | $103,600 |
| 2019 | $2,846 | $148,600 | $52,800 | $95,800 |
| 2018 | $2,741 | $141,000 | $50,300 | $90,700 |
| 2017 | $2,602 | $134,100 | $48,300 | $85,800 |
| 2016 | $2,566 | $133,600 | $46,900 | $86,700 |
| 2015 | $2,415 | $125,500 | $46,900 | $78,600 |
Source: Public Records
Map
Nearby Homes
- 7 Crescent Way Unit 302
- 7 Crescent Way Unit 105
- 7 Crescent Way Unit 315
- 26 Cedar Lake Dr
- 19 Arnold Rd
- 504 Main St
- 368 Main St
- 5 Hinman St Unit 4
- 365 Main St Unit 3
- 24 Evergreen Ln
- 537 Main St
- 8 Village Green
- 73 New Boston Rd
- 11 Lauren Ln
- 19 Preserve Way
- 9 Haynes St
- 87 Holland Rd
- Lot B-6 River Rd
- 208 New Boston Rd
- 1 Chase Rd
Your Personal Tour Guide
Ask me questions while you tour the home.