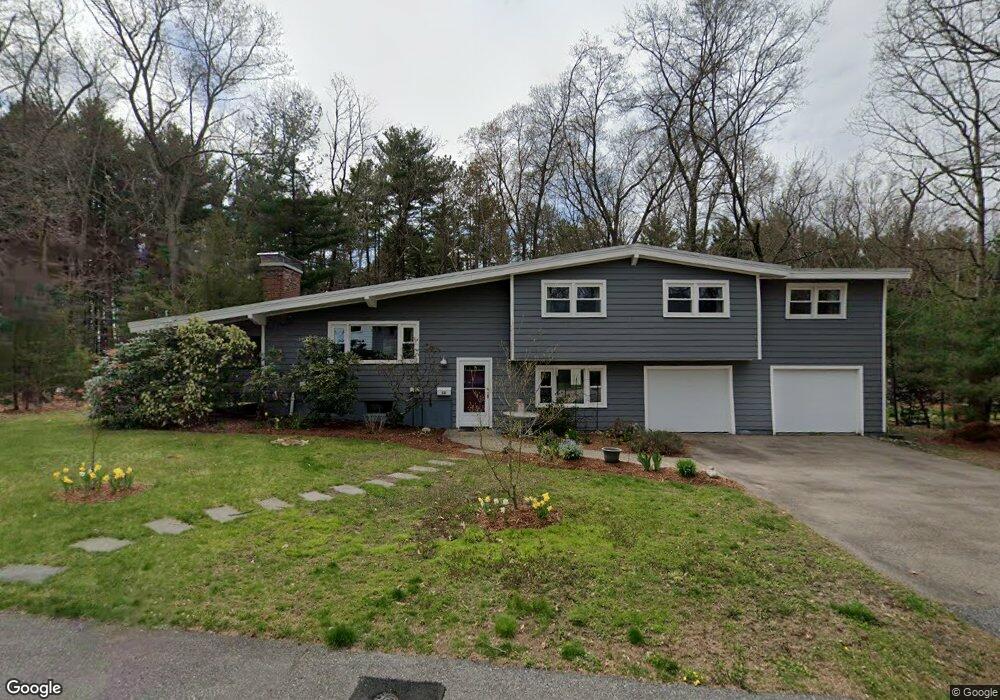
12 Spring Ln Framingham, MA 01701
Nobscot NeighborhoodEstimated Value: $658,000 - $891,000
3
Beds
3
Baths
1,740
Sq Ft
$428/Sq Ft
Est. Value
About This Home
This home is located at 12 Spring Ln, Framingham, MA 01701 and is currently estimated at $745,237, approximately $428 per square foot. 12 Spring Ln is a home located in Middlesex County with nearby schools including Framingham High School, MetroWest Jewish Day School, and Sudbury Valley School.
Ownership History
Date
Name
Owned For
Owner Type
Purchase Details
Closed on
Jul 15, 1992
Sold by
Ellison Howard and Ellison Melanie F
Bought by
Goldman Karen A and Salemi Raymond D
Current Estimated Value
Create a Home Valuation Report for This Property
The Home Valuation Report is an in-depth analysis detailing your home's value as well as a comparison with similar homes in the area
Home Values in the Area
Average Home Value in this Area
Purchase History
| Date | Buyer | Sale Price | Title Company |
|---|---|---|---|
| Goldman Karen A | $200,000 | -- | |
| Goldman Karen A | $200,000 | -- |
Source: Public Records
Mortgage History
| Date | Status | Borrower | Loan Amount |
|---|---|---|---|
| Open | Goldman Karen A | $220,000 | |
| Closed | Goldman Karen A | $25,000 | |
| Closed | Goldman Karen A | $176,000 |
Source: Public Records
Tax History
| Year | Tax Paid | Tax Assessment Tax Assessment Total Assessment is a certain percentage of the fair market value that is determined by local assessors to be the total taxable value of land and additions on the property. | Land | Improvement |
|---|---|---|---|---|
| 2025 | $7,594 | $636,000 | $271,700 | $364,300 |
| 2024 | $7,294 | $585,400 | $242,600 | $342,800 |
| 2023 | $6,840 | $522,500 | $216,600 | $305,900 |
| 2022 | $6,496 | $472,800 | $196,500 | $276,300 |
| 2021 | $6,351 | $452,000 | $188,900 | $263,100 |
| 2020 | $6,378 | $425,800 | $171,700 | $254,100 |
| 2019 | $6,184 | $402,100 | $171,700 | $230,400 |
| 2018 | $6,056 | $371,100 | $165,200 | $205,900 |
| 2017 | $5,884 | $352,100 | $160,400 | $191,700 |
| 2016 | $5,782 | $332,700 | $160,400 | $172,300 |
| 2015 | $5,722 | $321,100 | $160,900 | $160,200 |
Source: Public Records
Map
Nearby Homes
- 17 Oakvale Rd
- 915 Edgell Rd Unit 61
- 10 Rolling Ln
- 46 Brookfield Cir
- 472 Brook St
- 46 Perry Henderson Dr
- 7 Bayberry Ln
- 16 Bayberry Ln
- 11 Edith Rd
- 472 Potter Rd
- 231 Central St
- 32 Lyman Rd
- 19 Park Ave
- 484 Edgell Rd
- 32 Eaton Rd W
- 576 Grove St
- 9 Lands End Ln
- 108 Cherry St
- 32 Old Framingham Rd Unit 41
- 7 Ballydrain Rd
Your Personal Tour Guide
Ask me questions while you tour the home.