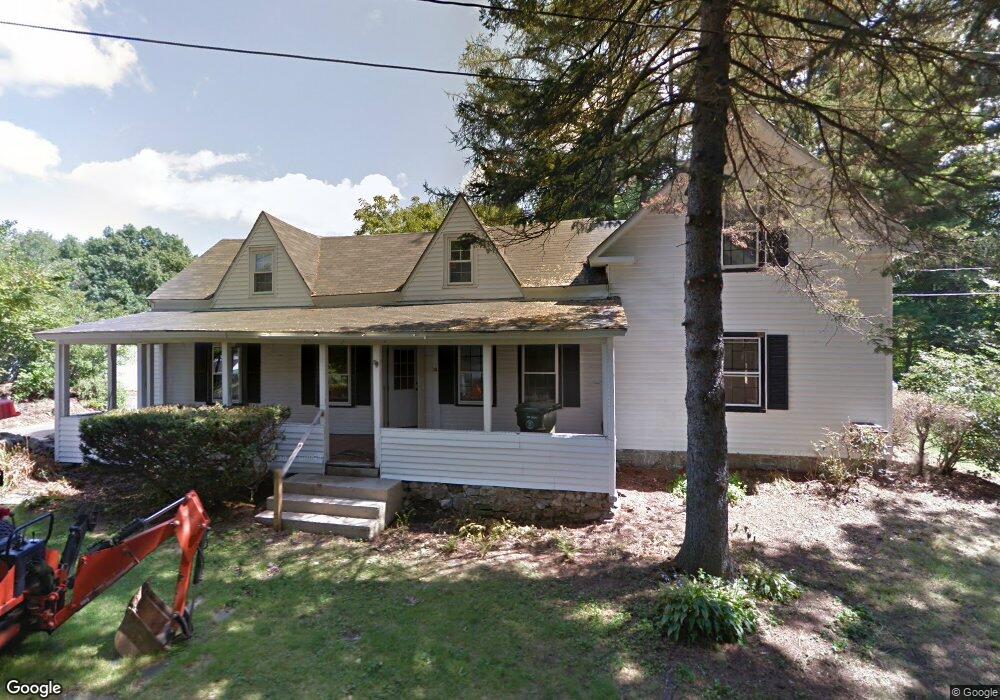
12 Stokes Rd Londonderry, NH 03053
Estimated Value: $466,000 - $636,000
4
Beds
2
Baths
1,868
Sq Ft
$285/Sq Ft
Est. Value
About This Home
This home is located at 12 Stokes Rd, Londonderry, NH 03053 and is currently estimated at $533,225, approximately $285 per square foot. 12 Stokes Rd is a home located in Rockingham County with nearby schools including North Londonderry Elementary School, Londonderry Middle School, and Londonderry Senior High School.
Ownership History
Date
Name
Owned For
Owner Type
Purchase Details
Closed on
Jun 25, 2014
Sold by
Maccall Laurence B and Maccall Laurie
Bought by
Sibley Michael E and Sibley Angela L
Current Estimated Value
Purchase Details
Closed on
Mar 29, 2013
Sold by
Stowell Brian K and Stowell Kayleen
Bought by
Stowell Kayleen and Maccall Laurence B
Purchase Details
Closed on
Mar 14, 2012
Sold by
Stowell Brian K
Bought by
Stowell Brian K and Stowell Kayleen
Purchase Details
Closed on
Jun 23, 2010
Sold by
Morshead Stephen C
Bought by
Us Bank Na Tr
Purchase Details
Closed on
Mar 30, 2004
Sold by
Second Storey Homes In
Bought by
Hughes Harold D and Hughes Karey A
Purchase Details
Closed on
Dec 17, 1997
Sold by
Forbush John M and Forbush Kathryn S
Bought by
Morshead Stephen C and Morshead Jennifer L
Create a Home Valuation Report for This Property
The Home Valuation Report is an in-depth analysis detailing your home's value as well as a comparison with similar homes in the area
Home Values in the Area
Average Home Value in this Area
Purchase History
| Date | Buyer | Sale Price | Title Company |
|---|---|---|---|
| Sibley Michael E | $180,300 | -- | |
| Sibley Michael E | $180,300 | -- | |
| Stowell Kayleen | -- | -- | |
| Stowell Kayleen | -- | -- | |
| Stowell Brian K | -- | -- | |
| Stowell Brian K | -- | -- | |
| Us Bank Na Tr | $212,100 | -- | |
| Us Bank Na Tr | $212,100 | -- | |
| Hughes Harold D | $299,900 | -- | |
| Morshead Stephen C | $120,000 | -- | |
| Morshead Stephen C | $120,000 | -- |
Source: Public Records
Mortgage History
| Date | Status | Borrower | Loan Amount |
|---|---|---|---|
| Previous Owner | Morshead Stephen C | $150,000 | |
| Previous Owner | Morshead Stephen C | $50,000 |
Source: Public Records
Tax History Compared to Growth
Tax History
| Year | Tax Paid | Tax Assessment Tax Assessment Total Assessment is a certain percentage of the fair market value that is determined by local assessors to be the total taxable value of land and additions on the property. | Land | Improvement |
|---|---|---|---|---|
| 2024 | $5,244 | $324,900 | $180,500 | $144,400 |
| 2023 | $5,085 | $324,900 | $180,500 | $144,400 |
| 2022 | $4,925 | $266,500 | $135,400 | $131,100 |
| 2021 | $4,898 | $266,500 | $135,400 | $131,100 |
| 2020 | $5,009 | $249,100 | $112,700 | $136,400 |
| 2019 | $4,830 | $249,100 | $112,700 | $136,400 |
| 2018 | $4,443 | $203,800 | $94,000 | $109,800 |
| 2017 | $3,037 | $202,100 | $94,000 | $108,100 |
| 2016 | $4,345 | $202,100 | $94,000 | $108,100 |
| 2015 | $4,248 | $202,100 | $94,000 | $108,100 |
| 2014 | $4,262 | $202,100 | $94,000 | $108,100 |
| 2011 | -- | $270,300 | $94,000 | $176,300 |
Source: Public Records
Map
Nearby Homes
- 8 Barksdale Ave
- 28 Barksdale Ave
- 27 Buckingham Dr
- 4 Crestview Cir Unit 119
- 32 Noyes Rd
- 17 Welch Rd
- 36 Perkins Rd
- 38 Bartley Hill Rd
- 50 Bartley Hill Rd
- 10 Auburn Rd
- 19 Auburn Rd
- 5 Webster Rd
- 15 Harvey Rd
- 103 Rockingham Rd Unit 1
- 103 Rockingham Rd Unit 2
- 6a Walton Cir
- 90 Forest Hill Way Unit 52
- 12 Forest Hill Way Unit 57
- 1991 Bodwell Rd Unit 30
- 1035 S Mammoth Rd Unit 6
- 12A Stokes Rd
- 10 Stokes Rd
- 16 Stokes Rd
- 18 Stokes Rd
- 14 Stokes Rd
- 4 Stokes Rd
- 226 Rockingham Rd
- 226 Rockingham Rd
- 501 Mammoth Rd
- 501 Mammoth Rd Unit 5
- 232 Rockingham Rd
- 232 Rockingham Rd
- 2 Eglin Blvd
- 497 Mammoth Rd Unit 122
- 497 Mammoth Rd
- 1 Hunter Blvd
- 497 Mammoth Rd R 122
- 4 Eglin Blvd
- 216 Rockingham Rd
- 5 Eglin Blvd