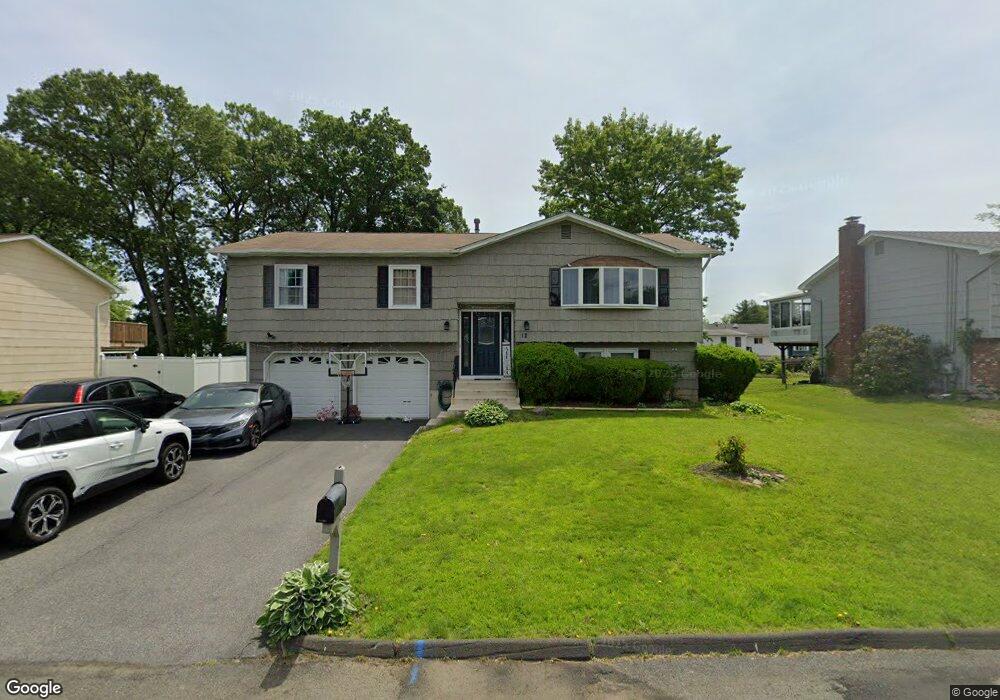
12 Stubbe Dr Stony Point, NY 10980
Estimated Value: $670,000 - $749,495
4
Beds
3
Baths
1,865
Sq Ft
$377/Sq Ft
Est. Value
About This Home
This home is located at 12 Stubbe Dr, Stony Point, NY 10980 and is currently estimated at $702,374, approximately $376 per square foot. 12 Stubbe Dr is a home located in Rockland County with nearby schools including James A. Farley Middle School, Stony Point Elementary School, and Fieldstone Secondary School.
Ownership History
Date
Name
Owned For
Owner Type
Purchase Details
Closed on
Mar 10, 2023
Sold by
Reynolds Stephen E and Reynolds Kristen A
Bought by
Flaim Maris and Parra Maurico
Current Estimated Value
Home Financials for this Owner
Home Financials are based on the most recent Mortgage that was taken out on this home.
Original Mortgage
$468,750
Outstanding Balance
$453,928
Interest Rate
6.09%
Mortgage Type
New Conventional
Estimated Equity
$248,446
Purchase Details
Closed on
Jul 31, 1997
Sold by
Marino Grace
Bought by
Reynolds Stephen E and Reynolds Kristen A
Home Financials for this Owner
Home Financials are based on the most recent Mortgage that was taken out on this home.
Original Mortgage
$165,000
Interest Rate
7.56%
Mortgage Type
Construction
Create a Home Valuation Report for This Property
The Home Valuation Report is an in-depth analysis detailing your home's value as well as a comparison with similar homes in the area
Home Values in the Area
Average Home Value in this Area
Purchase History
| Date | Buyer | Sale Price | Title Company |
|---|---|---|---|
| Flaim Maris | $625,000 | Commitment Title | |
| Reynolds Stephen E | $225,000 | -- |
Source: Public Records
Mortgage History
| Date | Status | Borrower | Loan Amount |
|---|---|---|---|
| Open | Flaim Maris | $468,750 | |
| Previous Owner | Reynolds Stephen E | $165,000 |
Source: Public Records
Tax History Compared to Growth
Tax History
| Year | Tax Paid | Tax Assessment Tax Assessment Total Assessment is a certain percentage of the fair market value that is determined by local assessors to be the total taxable value of land and additions on the property. | Land | Improvement |
|---|---|---|---|---|
| 2024 | $17,030 | $48,900 | $6,900 | $42,000 |
| 2023 | $17,030 | $48,900 | $6,900 | $42,000 |
| 2022 | $4,493 | $48,900 | $6,900 | $42,000 |
| 2021 | $4,493 | $48,900 | $6,900 | $42,000 |
| 2020 | $11,852 | $48,900 | $6,900 | $42,000 |
| 2019 | $3,684 | $48,900 | $6,900 | $42,000 |
| 2018 | $11,426 | $48,900 | $6,900 | $42,000 |
| 2017 | $11,246 | $48,900 | $6,900 | $42,000 |
| 2016 | $11,603 | $48,900 | $6,900 | $42,000 |
| 2015 | -- | $48,900 | $6,900 | $42,000 |
| 2014 | -- | $48,900 | $6,900 | $42,000 |
Source: Public Records
Map
Nearby Homes