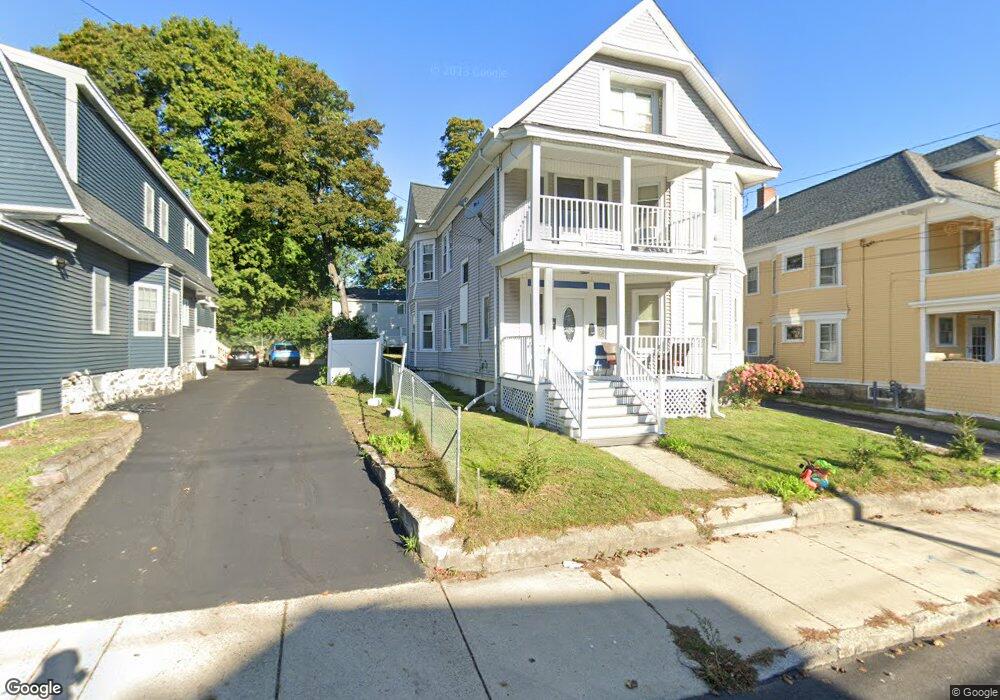
12 Swan St Lawrence, MA 01841
Prospect Hill-Back Bay NeighborhoodEstimated Value: $768,000 - $900,000
4
Beds
2
Baths
3,765
Sq Ft
$221/Sq Ft
Est. Value
About This Home
This home is located at 12 Swan St, Lawrence, MA 01841 and is currently estimated at $831,622, approximately $220 per square foot. 12 Swan St is a home located in Essex County with nearby schools including Olive Branch Elementary School and School For Exceptional Studies.
Ownership History
Date
Name
Owned For
Owner Type
Purchase Details
Closed on
Oct 14, 2004
Sold by
Mccarthy Mona K
Bought by
Joseph Jean and Joseph Clemene L
Current Estimated Value
Home Financials for this Owner
Home Financials are based on the most recent Mortgage that was taken out on this home.
Original Mortgage
$280,000
Outstanding Balance
$138,949
Interest Rate
5.8%
Mortgage Type
Purchase Money Mortgage
Estimated Equity
$692,673
Create a Home Valuation Report for This Property
The Home Valuation Report is an in-depth analysis detailing your home's value as well as a comparison with similar homes in the area
Home Values in the Area
Average Home Value in this Area
Purchase History
| Date | Buyer | Sale Price | Title Company |
|---|---|---|---|
| Joseph Jean | $350,000 | -- |
Source: Public Records
Mortgage History
| Date | Status | Borrower | Loan Amount |
|---|---|---|---|
| Open | Joseph Jean | $280,000 |
Source: Public Records
Tax History Compared to Growth
Tax History
| Year | Tax Paid | Tax Assessment Tax Assessment Total Assessment is a certain percentage of the fair market value that is determined by local assessors to be the total taxable value of land and additions on the property. | Land | Improvement |
|---|---|---|---|---|
| 2025 | $7,462 | $847,900 | $148,400 | $699,500 |
| 2024 | $6,865 | $742,200 | $109,700 | $632,500 |
| 2023 | $7,235 | $712,100 | $107,000 | $605,100 |
| 2022 | $6,833 | $597,300 | $107,000 | $490,300 |
| 2021 | $6,621 | $539,600 | $107,000 | $432,600 |
| 2020 | $6,538 | $526,000 | $96,200 | $429,800 |
| 2019 | $5,975 | $436,800 | $86,500 | $350,300 |
| 2018 | $5,459 | $381,200 | $74,400 | $306,800 |
| 2017 | $5,159 | $336,300 | $73,600 | $262,700 |
| 2016 | $4,803 | $309,700 | $53,600 | $256,100 |
| 2015 | $4,420 | $292,300 | $53,600 | $238,700 |
Source: Public Records
Map
Nearby Homes
- 169 Berkeley St
- 6 Longwood Dr
- 183 Berkeley St
- 20 Knox St Unit 43
- 20 Knox St Unit 23
- 129-131 Lexington St
- 7 Magnolia Rd
- 5 Arlington Terrace
- 100-102 E Haverhill St
- 24 Boylston St
- 35 Kendall St
- 83 Oakside Ave
- 24 Court St
- 15 Swan Ave
- 24 Bennington St
- 87 Oakside Ave
- 364 Lawrence St
- 82 Oakside Ave
- 9 Boylston St
- 2 Lawrence St
- 20 Swan St Unit 22
- 18 Swan St
- 14 Swan St Unit 16
- 10 Swan St
- 21-23 Swan St
- 21 Swan St Unit 23
- 20-22 Swan St
- 29 Swan St
- 17 Swan St Unit 19
- 17-19 Swan St
- 24-26 Swan St
- 24 Swan St Unit 26
- 10 Cornish St Unit 12
- 35 Swan St
- 13 Swan St Unit 15
- 39 Swan St Unit 41
- 39 - 41 Swan St
- 12 Cornish Rd
- 6 Cornish Rd
- 28 Swan St Unit 30