Estimated Value: $823,000 - $1,017,000
4
Beds
3
Baths
3,328
Sq Ft
$265/Sq Ft
Est. Value
About This Home
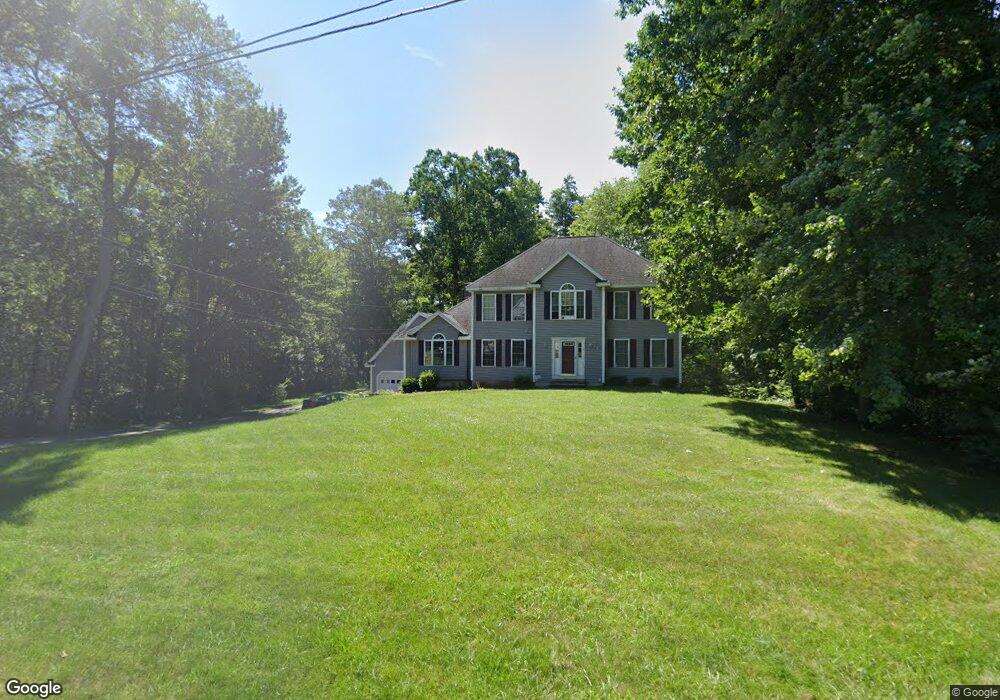
This home is located at 12 Sycamore Ave, Salem, NH 03079 and is currently estimated at $882,980, approximately $265 per square foot. 12 Sycamore Ave is a home located in Rockingham County with nearby schools including Mary A. Fisk Elementary School, Woodbury School, and Salem High School.
Ownership History
Date
Name
Owned For
Owner Type
Purchase Details
Closed on
Dec 30, 2021
Sold by
Delvecchio Mark S and Delvecchio Jian A
Bought by
Delvecchio Ft
Current Estimated Value
Purchase Details
Closed on
Dec 3, 2001
Sold by
Donigian Jacob A
Bought by
Delvecchio Mark S and Delvecchio Jian A
Home Financials for this Owner
Home Financials are based on the most recent Mortgage that was taken out on this home.
Original Mortgage
$275,000
Interest Rate
6.66%
Create a Home Valuation Report for This Property
The Home Valuation Report is an in-depth analysis detailing your home's value as well as a comparison with similar homes in the area
Home Values in the Area
Average Home Value in this Area
Purchase History
| Date | Buyer | Sale Price | Title Company |
|---|---|---|---|
| Delvecchio Ft | -- | None Available | |
| Delvecchio Mark S | $389,900 | -- |
Source: Public Records
Mortgage History
| Date | Status | Borrower | Loan Amount |
|---|---|---|---|
| Previous Owner | Delvecchio Mark S | $316,000 | |
| Previous Owner | Delvecchio Mark S | $275,000 |
Source: Public Records
Tax History Compared to Growth
Tax History
| Year | Tax Paid | Tax Assessment Tax Assessment Total Assessment is a certain percentage of the fair market value that is determined by local assessors to be the total taxable value of land and additions on the property. | Land | Improvement |
|---|---|---|---|---|
| 2024 | $11,743 | $667,200 | $220,000 | $447,200 |
| 2023 | $11,316 | $667,200 | $220,000 | $447,200 |
| 2022 | $10,709 | $667,200 | $220,000 | $447,200 |
| 2021 | $10,662 | $667,200 | $220,000 | $447,200 |
| 2020 | $10,633 | $482,900 | $157,500 | $325,400 |
| 2019 | $10,614 | $482,900 | $157,500 | $325,400 |
| 2018 | $10,290 | $489,000 | $157,500 | $331,500 |
| 2017 | $9,990 | $489,000 | $157,500 | $331,500 |
| 2016 | $9,990 | $489,000 | $157,500 | $331,500 |
| 2015 | $9,371 | $438,100 | $155,100 | $283,000 |
| 2014 | $9,108 | $438,100 | $155,100 | $283,000 |
| 2013 | $8,964 | $438,100 | $155,100 | $283,000 |
Source: Public Records
Map
Nearby Homes
- 3 Sycamore Ave
- 6-18 Mary Anthony Dr
- 92 Lowell Rd
- 56 Nelson St
- 38 Rosemary St
- 2 Hall Ave
- 133 Brookdale Rd
- 19A Winter St
- 26 Plower Rd Unit 6
- 75 S Policy St Unit 45
- 75 S Policy St Unit 48
- 11 Surrey Ln
- 108 S Shore Rd
- 3 S Shore Rd
- 3 Kennedy Dr
- 146 S Policy St
- 39 Ticklefancy Ln
- 17 Clinton St
- 0 Carmel Rd Unit 6
- 11 Maclarnon Rd
- 10 Sycamore Ave
- 11 Sycamore Ave
- 9 Sycamore Ave
- 175 Porcupine Cir
- 173 Porcupine Cir
- 8 Sycamore Ave
- 183 Porcupine Cir
- 191 Porcupine Cir
- 13 Sycamore Ave
- 1 Maronos Dr
- 189 Porcupine Cir
- 189 Porcupine Cir Unit R
- 189 Porcupine Cir Unit 1
- 14 Sycamore Ave
- 4 Maronos Dr
- 6 Sycamore Ave
- 3 Leonard Ln
- 5 Sycamore Ave
- 182 Porcupine Cir
- 194 Porcupine Cir