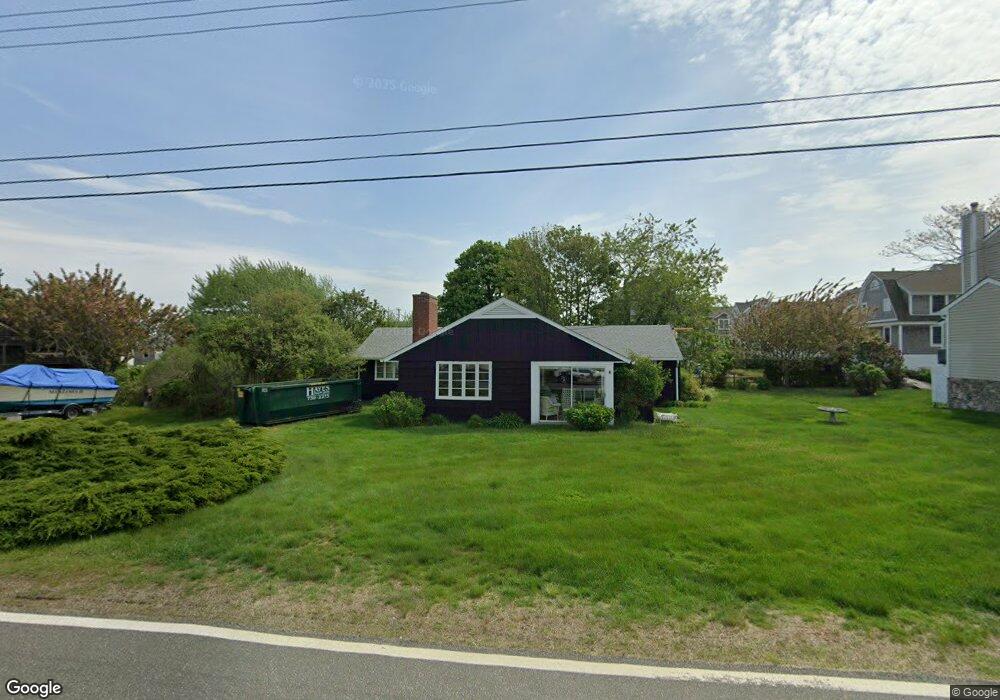
12 Tautog St Groton, CT 06340
Estimated Value: $824,000 - $1,008,000
3
Beds
3
Baths
1,338
Sq Ft
$693/Sq Ft
Est. Value
About This Home
This home is located at 12 Tautog St, Groton, CT 06340 and is currently estimated at $927,397, approximately $693 per square foot. 12 Tautog St is a home located in New London County with nearby schools including Groton Middle School and Robert E. Fitch High School.
Ownership History
Date
Name
Owned For
Owner Type
Purchase Details
Closed on
Apr 1, 2024
Sold by
Tyler Brooke
Bought by
Ritta Tyler T and Ritta Tyler
Current Estimated Value
Purchase Details
Closed on
Apr 17, 2017
Sold by
Tyler William A
Bought by
Tyler 3Rd M Brooke
Purchase Details
Closed on
Apr 10, 2017
Sold by
Tyler Riitta M
Bought by
Tyler William A
Purchase Details
Closed on
Dec 28, 2015
Sold by
Tyler 3Rd M Brooke and Tyler William A
Bought by
Tyler 3Rd M Brooke and Tyler Riitta M
Home Financials for this Owner
Home Financials are based on the most recent Mortgage that was taken out on this home.
Original Mortgage
$303,000
Interest Rate
3.99%
Mortgage Type
New Conventional
Create a Home Valuation Report for This Property
The Home Valuation Report is an in-depth analysis detailing your home's value as well as a comparison with similar homes in the area
Home Values in the Area
Average Home Value in this Area
Purchase History
| Date | Buyer | Sale Price | Title Company |
|---|---|---|---|
| Ritta Tyler T | -- | None Available | |
| Ritta Tyler T | -- | None Available | |
| Tyler 3Rd M Brooke | $200,000 | -- | |
| Tyler William A | -- | -- | |
| Tyler 3Rd M Brooke | -- | -- | |
| Tyler 3Rd M Brooke | $200,000 | -- | |
| Tyler William A | -- | -- | |
| Tyler 3Rd M Brooke | -- | -- |
Source: Public Records
Mortgage History
| Date | Status | Borrower | Loan Amount |
|---|---|---|---|
| Previous Owner | Tyler 3Rd M Brooke | $303,000 | |
| Previous Owner | Tyler 3Rd M Brooke | $236,000 |
Source: Public Records
Tax History Compared to Growth
Tax History
| Year | Tax Paid | Tax Assessment Tax Assessment Total Assessment is a certain percentage of the fair market value that is determined by local assessors to be the total taxable value of land and additions on the property. | Land | Improvement |
|---|---|---|---|---|
| 2025 | $11,950 | $424,200 | $314,734 | $109,466 |
| 2024 | $11,216 | $424,200 | $314,734 | $109,466 |
| 2023 | $10,397 | $407,890 | $267,820 | $140,070 |
| 2022 | $10,201 | $407,890 | $267,820 | $140,070 |
| 2021 | $10,334 | $343,210 | $267,820 | $75,390 |
| 2020 | $10,182 | $343,210 | $267,820 | $75,390 |
| 2019 | $9,763 | $343,210 | $267,820 | $75,390 |
| 2018 | $9,569 | $343,210 | $267,820 | $75,390 |
| 2017 | $9,380 | $343,210 | $267,820 | $75,390 |
| 2016 | $10,114 | $409,080 | $315,210 | $93,870 |
Source: Public Records
Map
Nearby Homes