
Seller's Agent in 2020
Lydia Foley
Purple Finch Properties
(603) 670-4996
9 in this area
149 Total Sales

Estimated Value: $675,000 - $786,000
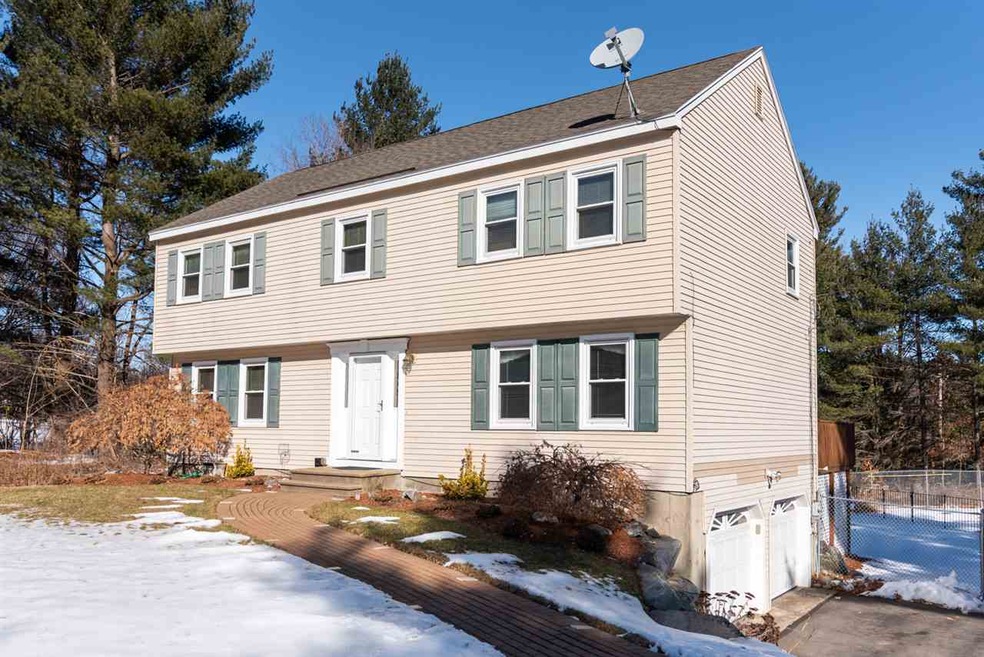
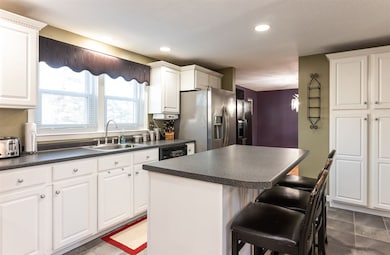
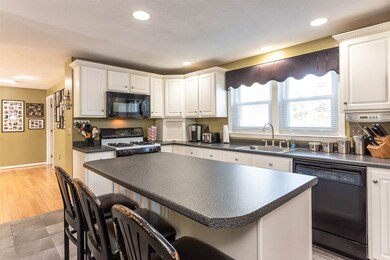
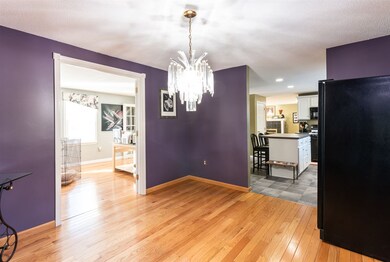
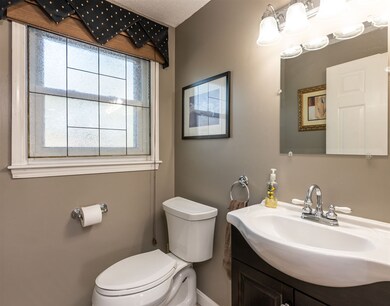
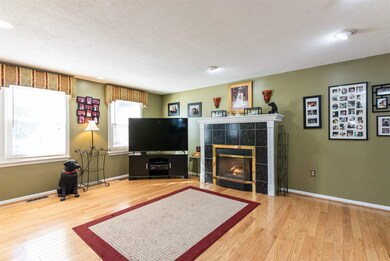
Just Listed! This 4 bedroom, 2.5 bathroom home is the one you've been waiting for! Located in a cul-de-sac neighborhood. As you walk through the front door you will find an easy flowing floor plan with a formal living room with french doors to the formal dining room, kitchen with island, half bathroom, family room with access to the over-sized deck through the 1st floor laundry room. On the second floor there are 3 great sized bedrooms and a full bathroom as well as the Master Bedroom with full bathroom and walk in closet. Lower level has a finished family room and the two car garage. Huge level lot on 0.427 Acres which is the perfect setting for summer days with the in-ground pool. Walking distance to Nashua High North and Broad St Elementary School. Welcome Home!
Last Agent to Sell the Property
Purple Finch Properties License #066713 Listed on: 01/22/2020
| Date | Buyer | Sale Price | Title Company |
|---|---|---|---|
| Kilimonis Michelle | $413,000 | None Available | |
| Morales Miguel A | $134,500 | -- |
| Date | Status | Borrower | Loan Amount |
|---|---|---|---|
| Open | Kilimonis Michelle | $392,350 | |
| Previous Owner | Morales Miguel A | $21,000 | |
| Previous Owner | Morales Miguel A | $133,794 |
| Date | Event | Price | List to Sale | Price per Sq Ft |
|---|---|---|---|---|
| 04/23/2020 04/23/20 | Sold | $413,000 | +0.8% | $201 / Sq Ft |
| 01/25/2020 01/25/20 | Pending | -- | -- | -- |
| 01/22/2020 01/22/20 | For Sale | $409,900 | -- | $199 / Sq Ft |
| Year | Tax Paid | Tax Assessment Tax Assessment Total Assessment is a certain percentage of the fair market value that is determined by local assessors to be the total taxable value of land and additions on the property. | Land | Improvement |
|---|---|---|---|---|
| 2024 | $9,413 | $592,000 | $172,500 | $419,500 |
| 2023 | $9,367 | $513,800 | $138,000 | $375,800 |
| 2022 | $9,284 | $513,800 | $138,000 | $375,800 |
| 2021 | $8,297 | $357,300 | $92,000 | $265,300 |
| 2020 | $7,760 | $343,200 | $92,000 | $251,200 |
| 2019 | $7,468 | $343,200 | $92,000 | $251,200 |
| 2018 | $7,279 | $343,200 | $92,000 | $251,200 |
| 2017 | $7,164 | $277,800 | $79,700 | $198,100 |
| 2016 | $6,964 | $277,800 | $79,700 | $198,100 |
| 2015 | $6,814 | $277,800 | $79,700 | $198,100 |
| 2014 | $6,681 | $277,800 | $79,700 | $198,100 |
Seller's Agent in 2020
Lydia Foley
Purple Finch Properties
(603) 670-4996
9 in this area
149 Total Sales
Buyer's Agent in 2020
David Sanborn
Senoba Real Estate
(603) 440-4195
1 in this area
39 Total Sales
Source: PrimeMLS
MLS Number: 4791094
APN: NASH-000000-000000-000963F
Disclaimer: Certain information contained herein is derived from information provided by parties other than Homes.com. All information provided is deemed reliable, but is not guaranteed to be accurate and should be independently verified.
![]() Copyright 2025 PrimeMLS, Inc. All rights reserved. This information is deemed reliable, but not guaranteed. The data relating to real estate displayed on this display comes in part from the IDX Program of PrimeMLS. The information being provided is for consumers’ personal, non-commercial use and may not be used for any purpose other than to identify prospective properties consumers may be interested in purchasing.
Copyright 2025 PrimeMLS, Inc. All rights reserved. This information is deemed reliable, but not guaranteed. The data relating to real estate displayed on this display comes in part from the IDX Program of PrimeMLS. The information being provided is for consumers’ personal, non-commercial use and may not be used for any purpose other than to identify prospective properties consumers may be interested in purchasing.