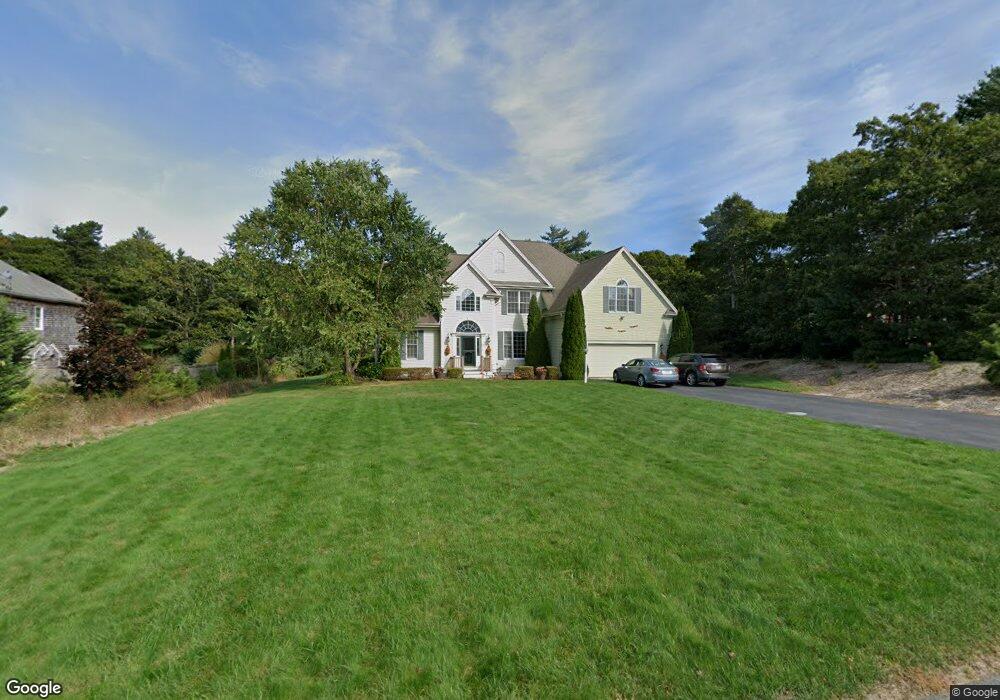
12 Tiffany Rd Bourne, MA 2532
Monument Beach NeighborhoodEstimated Value: $888,000 - $1,145,000
4
Beds
4
Baths
2,681
Sq Ft
$388/Sq Ft
Est. Value
About This Home
This home is located at 12 Tiffany Rd, Bourne, MA 2532 and is currently estimated at $1,041,251, approximately $388 per square foot. 12 Tiffany Rd is a home located in Barnstable County with nearby schools including Bourne High School, Cadence Academy Preschool - Bourne, and St Margaret Regional School.
Ownership History
Date
Name
Owned For
Owner Type
Purchase Details
Closed on
Aug 15, 2003
Sold by
Cohen Richard R and Cohen David H
Bought by
Holmes Stephen P
Current Estimated Value
Home Financials for this Owner
Home Financials are based on the most recent Mortgage that was taken out on this home.
Original Mortgage
$420,000
Outstanding Balance
$182,795
Interest Rate
5.46%
Mortgage Type
Purchase Money Mortgage
Estimated Equity
$858,456
Purchase Details
Closed on
Dec 18, 2002
Sold by
Old Centre Homes Rt
Bought by
Cohen Richard R and Cohen David H
Home Financials for this Owner
Home Financials are based on the most recent Mortgage that was taken out on this home.
Original Mortgage
$350,000
Interest Rate
6.16%
Mortgage Type
Purchase Money Mortgage
Create a Home Valuation Report for This Property
The Home Valuation Report is an in-depth analysis detailing your home's value as well as a comparison with similar homes in the area
Home Values in the Area
Average Home Value in this Area
Purchase History
We collect this data history from publicly available records. To have your information removed, we recommend requesting removal directly through your county’s website.
| Date | Buyer | Sale Price | Title Company |
|---|---|---|---|
| Holmes Stephen P | $559,500 | -- | |
| Holmes Stephen P | $559,500 | -- | |
| Cohen Richard R | $180,000 | -- | |
| Cohen Richard R | $180,000 | -- |
Source: Public Records
Mortgage History
We collect this data history from publicly available records. To have your information removed, we recommend requesting removal directly through your county’s website.
| Date | Status | Borrower | Loan Amount |
|---|---|---|---|
| Open | Cohen Richard R | $420,000 | |
| Closed | Cohen Richard R | $420,000 | |
| Previous Owner | Cohen Richard R | $350,000 |
Source: Public Records
Tax History
| Year | Tax Paid | Tax Assessment Tax Assessment Total Assessment is a certain percentage of the fair market value that is determined by local assessors to be the total taxable value of land and additions on the property. | Land | Improvement |
|---|---|---|---|---|
| 2025 | $7,937 | $1,016,300 | $238,700 | $777,600 |
| 2024 | $7,350 | $916,400 | $227,300 | $689,100 |
| 2023 | $7,163 | $813,100 | $201,200 | $611,900 |
| 2022 | $6,787 | $672,600 | $178,000 | $494,600 |
| 2021 | $6,669 | $619,200 | $162,000 | $457,200 |
| 2020 | $6,527 | $607,700 | $160,500 | $447,200 |
| 2019 | $6,185 | $588,500 | $160,500 | $428,000 |
| 2018 | $5,886 | $558,400 | $145,600 | $412,800 |
| 2017 | $5,695 | $552,900 | $144,200 | $408,700 |
| 2016 | $5,443 | $535,700 | $137,000 | $398,700 |
| 2015 | $5,249 | $521,300 | $122,600 | $398,700 |
Source: Public Records
Map
Nearby Homes
- 10 Howard Ave
- 21 Clay Pond Rd
- 47 Cliff Rd
- 77 Roundhouse Rd Unit 77
- 49 Round House Rd
- 551 Shore Rd
- 119 Valley Bars Rd
- 566 Shore Rd
- 40 Bennets Neck Dr
- 30 Harbor Hill Dr Unit 30
- 11 Harbor Hill Dr
- 16 Amberwood Ct
- 2 Amberwood Ct Unit 2
- 2 Amberwood Ct Unit 2
- 6 Amberwood Ct Unit 216
- 6 Amberwood Ct Unit 6
- 36 Turnberry Rd Unit 36
- 5 Blue Meadow Ct Unit 5
- 22 Prestwick Rd Unit 22
- 3 Periwinkle Ct
Your Personal Tour Guide
Ask me questions while you tour the home.