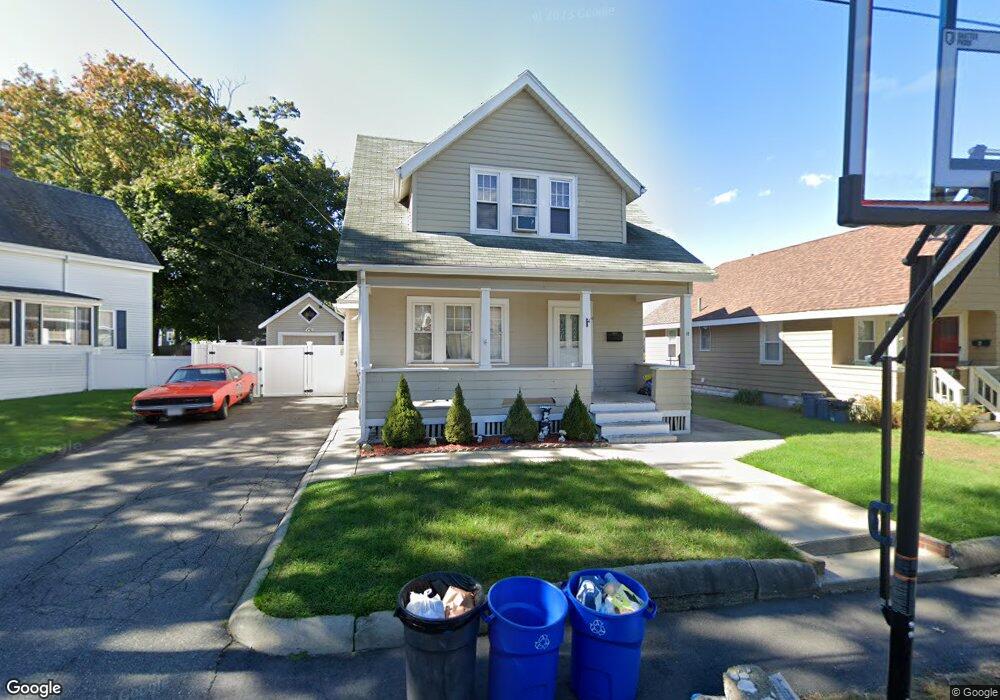
12 Tuttle St Saugus, MA 01906
Pleasant Hills NeighborhoodEstimated Value: $608,548 - $762,000
3
Beds
2
Baths
1,325
Sq Ft
$524/Sq Ft
Est. Value
About This Home
This home is located at 12 Tuttle St, Saugus, MA 01906 and is currently estimated at $694,637, approximately $524 per square foot. 12 Tuttle St is a home located in Essex County with nearby schools including Saugus High School and Pioneer Charter School Of Science II.
Ownership History
Date
Name
Owned For
Owner Type
Purchase Details
Closed on
Jul 27, 2010
Sold by
Bahatouris Georgia
Bought by
Federico Paul P and Federico Lori A
Current Estimated Value
Home Financials for this Owner
Home Financials are based on the most recent Mortgage that was taken out on this home.
Original Mortgage
$300,947
Outstanding Balance
$201,157
Interest Rate
4.76%
Mortgage Type
Purchase Money Mortgage
Estimated Equity
$493,481
Purchase Details
Closed on
Jul 24, 2007
Sold by
Oleary Lisa A and Oleary Timothy A
Bought by
Bahatouris Georgia
Home Financials for this Owner
Home Financials are based on the most recent Mortgage that was taken out on this home.
Original Mortgage
$224,000
Interest Rate
6.54%
Mortgage Type
Purchase Money Mortgage
Purchase Details
Closed on
Jun 28, 2002
Sold by
Oxley Richard P and Oxley Catherine M
Bought by
Oleary Timothy A and Oleary Lisa A
Create a Home Valuation Report for This Property
The Home Valuation Report is an in-depth analysis detailing your home's value as well as a comparison with similar homes in the area
Home Values in the Area
Average Home Value in this Area
Purchase History
| Date | Buyer | Sale Price | Title Company |
|---|---|---|---|
| Federico Paul P | $305,000 | -- | |
| Bahatouris Georgia | $320,000 | -- | |
| Oleary Timothy A | $285,000 | -- |
Source: Public Records
Mortgage History
| Date | Status | Borrower | Loan Amount |
|---|---|---|---|
| Open | Oleary Timothy A | $300,947 | |
| Previous Owner | Oleary Timothy A | $225,500 | |
| Previous Owner | Oleary Timothy A | $224,000 | |
| Previous Owner | Oleary Timothy A | $304,000 |
Source: Public Records
Tax History
| Year | Tax Paid | Tax Assessment Tax Assessment Total Assessment is a certain percentage of the fair market value that is determined by local assessors to be the total taxable value of land and additions on the property. | Land | Improvement |
|---|---|---|---|---|
| 2025 | $5,871 | $549,700 | $296,000 | $253,700 |
| 2024 | $5,622 | $527,900 | $279,100 | $248,800 |
| 2023 | $5,501 | $488,500 | $245,300 | $243,200 |
| 2022 | $5,425 | $451,700 | $225,000 | $226,700 |
| 2021 | $5,109 | $414,000 | $195,400 | $218,600 |
| 2020 | $4,724 | $396,300 | $186,100 | $210,200 |
| 2019 | $4,278 | $351,200 | $169,200 | $182,000 |
| 2018 | $3,899 | $336,700 | $164,100 | $172,600 |
| 2017 | $3,822 | $317,200 | $153,100 | $164,100 |
| 2016 | $3,627 | $297,300 | $152,100 | $145,200 |
| 2015 | $3,403 | $283,100 | $144,900 | $138,200 |
| 2014 | $3,237 | $278,800 | $144,900 | $133,900 |
Source: Public Records
Map
Nearby Homes
- 141 Essex St Unit B1
- 141 Essex St Unit D6
- 141 Essex St Unit B4
- 20 Maple St
- 10 Allison Rd
- 31 Mountain Ave
- 7 Adams Ave
- 32-34 Mount Vernon St
- 57 Vine St
- 19 Laurel St
- 20 Palmer Ave
- 360 Lincoln Ave
- 12B Cheever Ave
- 12C Cheever Ave
- 2 Ashford St
- 25 Auburn St
- 43 Taylor St
- 36 Jasper St
- 34 Summer St
- 133 Salem St Unit 414
Your Personal Tour Guide
Ask me questions while you tour the home.