
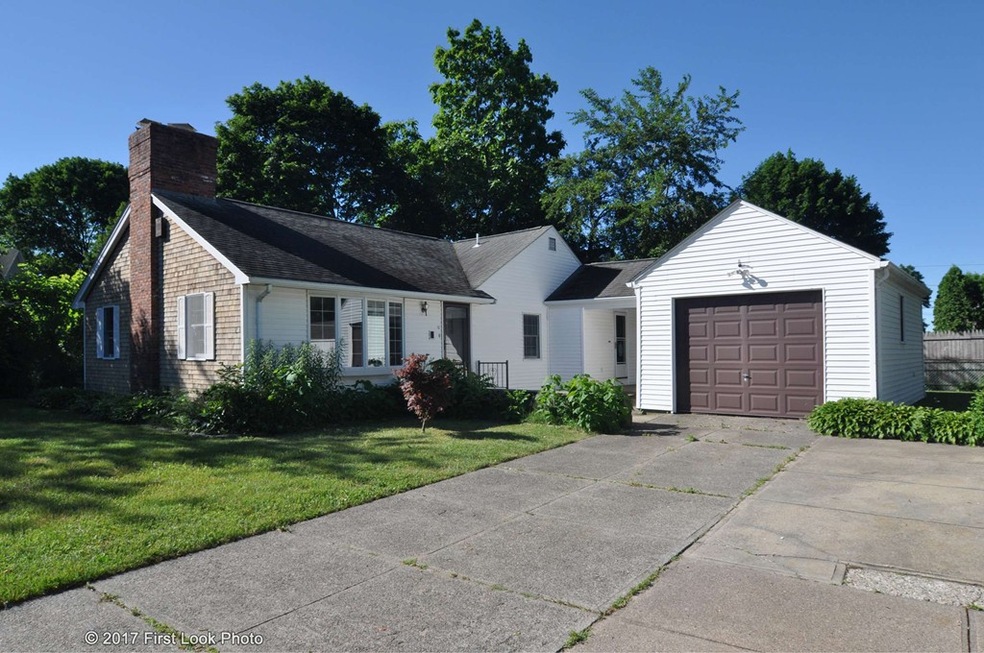
12 W Carpenter St Attleboro, MA 02703
South Attleboro Village NeighborhoodEstimated Value: $444,000 - $493,000
3
Beds
1
Bath
1,700
Sq Ft
$280/Sq Ft
Est. Value
About This Home
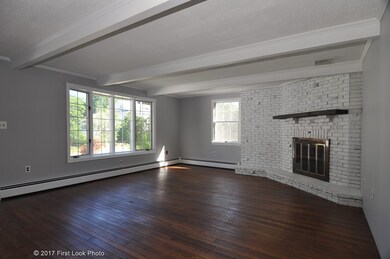
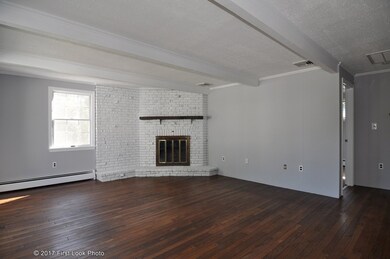
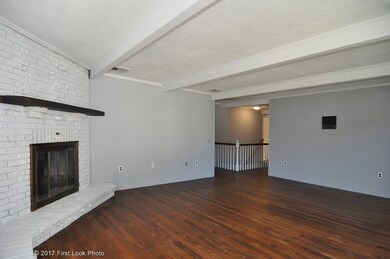
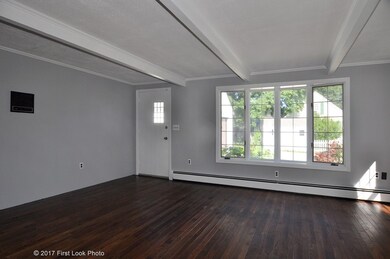
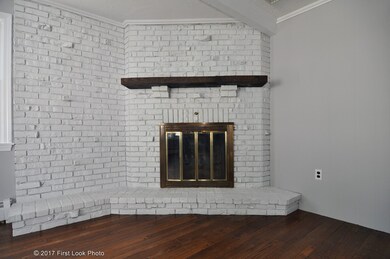
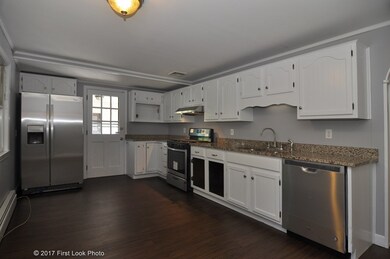
As of February 2018Spacious, refinished home with alot to offer! Featuring refinished hardwood floors in main living areas, granite counters and stainless appliances in huge kitchen. Abundant living room space featuring brick fireplace and classic ceiling beams. Spacious bedrooms feature new carpeting and fresh paint. Huge finished basement for extra living area! Central air, 1 car garage, private tree-lined/fenced yard nestled in a large lot.
Ownership History
Date
Name
Owned For
Owner Type
Purchase Details
Listed on
Dec 5, 2016
Closed on
May 22, 2017
Sold by
Department Of Housing & Urban Dev
Bought by
Aronson Neil
Seller's Agent
Nick Cantave
Cantave Realty Group, Inc.
Buyer's Agent
John Somyk
Keller Williams Realty Leading Edge
List Price
$214,130
Sold Price
$195,000
Premium/Discount to List
-$19,130
-8.93%
Total Days on Market
174
Current Estimated Value
Home Financials for this Owner
Home Financials are based on the most recent Mortgage that was taken out on this home.
Estimated Appreciation
$280,414
Avg. Annual Appreciation
11.72%
Purchase Details
Closed on
Dec 15, 2008
Sold by
Heagney Michele V and Heagney Stephen J
Bought by
Selby Donald A and Selby Sharon L
Home Financials for this Owner
Home Financials are based on the most recent Mortgage that was taken out on this home.
Original Mortgage
$254,146
Interest Rate
6.49%
Mortgage Type
Purchase Money Mortgage
Purchase Details
Closed on
Nov 28, 1988
Sold by
Galvin Brenda Lee
Bought by
Heagney Sttephen J
Home Financials for this Owner
Home Financials are based on the most recent Mortgage that was taken out on this home.
Original Mortgage
$114,900
Interest Rate
10.21%
Mortgage Type
Purchase Money Mortgage
Similar Homes in Attleboro, MA
Create a Home Valuation Report for This Property
The Home Valuation Report is an in-depth analysis detailing your home's value as well as a comparison with similar homes in the area
Home Values in the Area
Average Home Value in this Area
Purchase History
| Date | Buyer | Sale Price | Title Company |
|---|---|---|---|
| Aronson Neil | $195,000 | -- | |
| Selby Donald A | $257,500 | -- | |
| Heagney Sttephen J | $129,900 | -- |
Source: Public Records
Mortgage History
| Date | Status | Borrower | Loan Amount |
|---|---|---|---|
| Open | Pitts Jerome L | $327,000 | |
| Closed | Pitts Jerome L | $257,500 | |
| Previous Owner | Selby Donald A | $254,146 | |
| Previous Owner | Heagney Stephen J | $64,000 | |
| Previous Owner | Heagney Sttephen J | $110,700 | |
| Previous Owner | Heagney Sttephen J | $114,900 |
Source: Public Records
Property History
| Date | Event | Price | Change | Sq Ft Price |
|---|---|---|---|---|
| 02/16/2018 02/16/18 | Sold | $257,500 | 0.0% | $151 / Sq Ft |
| 12/21/2017 12/21/17 | Pending | -- | -- | -- |
| 12/20/2017 12/20/17 | Off Market | $257,500 | -- | -- |
| 12/05/2017 12/05/17 | Price Changed | $264,000 | -0.2% | $155 / Sq Ft |
| 11/28/2017 11/28/17 | Price Changed | $264,500 | -0.2% | $156 / Sq Ft |
| 11/14/2017 11/14/17 | Price Changed | $265,000 | -0.7% | $156 / Sq Ft |
| 11/07/2017 11/07/17 | Price Changed | $267,000 | -0.2% | $157 / Sq Ft |
| 10/31/2017 10/31/17 | Price Changed | $267,500 | -0.9% | $157 / Sq Ft |
| 10/16/2017 10/16/17 | For Sale | $269,900 | 0.0% | $159 / Sq Ft |
| 10/11/2017 10/11/17 | Pending | -- | -- | -- |
| 10/02/2017 10/02/17 | Price Changed | $269,900 | -1.0% | $159 / Sq Ft |
| 09/11/2017 09/11/17 | Price Changed | $272,500 | -0.9% | $160 / Sq Ft |
| 08/22/2017 08/22/17 | Price Changed | $275,000 | -1.4% | $162 / Sq Ft |
| 08/09/2017 08/09/17 | Price Changed | $279,000 | -0.3% | $164 / Sq Ft |
| 07/30/2017 07/30/17 | Price Changed | $279,900 | -1.8% | $165 / Sq Ft |
| 07/18/2017 07/18/17 | Price Changed | $285,000 | -1.4% | $168 / Sq Ft |
| 06/30/2017 06/30/17 | For Sale | $289,000 | +48.2% | $170 / Sq Ft |
| 05/24/2017 05/24/17 | Sold | $195,000 | -8.9% | $152 / Sq Ft |
| 03/30/2017 03/30/17 | Pending | -- | -- | -- |
| 03/25/2017 03/25/17 | For Sale | $214,130 | +9.8% | $167 / Sq Ft |
| 03/22/2017 03/22/17 | Off Market | $195,000 | -- | -- |
| 03/13/2017 03/13/17 | Pending | -- | -- | -- |
| 03/03/2017 03/03/17 | Price Changed | $214,130 | -5.0% | $167 / Sq Ft |
| 02/24/2017 02/24/17 | For Sale | $225,400 | +15.6% | $176 / Sq Ft |
| 02/21/2017 02/21/17 | Off Market | $195,000 | -- | -- |
| 02/15/2017 02/15/17 | Pending | -- | -- | -- |
| 01/20/2017 01/20/17 | Price Changed | $225,400 | -8.0% | $176 / Sq Ft |
| 12/05/2016 12/05/16 | For Sale | $245,000 | -- | $191 / Sq Ft |
Source: MLS Property Information Network (MLS PIN)
Tax History Compared to Growth
Tax History
| Year | Tax Paid | Tax Assessment Tax Assessment Total Assessment is a certain percentage of the fair market value that is determined by local assessors to be the total taxable value of land and additions on the property. | Land | Improvement |
|---|---|---|---|---|
| 2025 | $5,326 | $424,400 | $123,000 | $301,400 |
| 2024 | $5,109 | $401,300 | $123,000 | $278,300 |
| 2023 | $4,807 | $351,100 | $111,800 | $239,300 |
| 2022 | $4,578 | $316,800 | $106,500 | $210,300 |
| 2021 | $5,197 | $282,900 | $102,400 | $180,500 |
| 2020 | $4,020 | $276,100 | $99,500 | $176,600 |
| 2019 | $3,835 | $270,800 | $97,600 | $173,200 |
| 2018 | $4,671 | $237,400 | $94,700 | $142,700 |
| 2017 | $4,362 | $223,300 | $94,700 | $128,600 |
| 2016 | $3,003 | $202,600 | $88,500 | $114,100 |
| 2015 | $3,002 | $204,100 | $88,500 | $115,600 |
| 2014 | $2,778 | $187,100 | $83,900 | $103,200 |
Source: Public Records
Agents Affiliated with this Home
-
Kyle Seyboth
Seller's Agent in 2018
Kyle Seyboth
Century 21 The Seyboth Team
(508) 726-3492
17 in this area
1,906 Total Sales
-
Sharon O'Reilly
Buyer's Agent in 2018
Sharon O'Reilly
ERA Key Realty Services- Milf
(508) 450-8335
45 Total Sales
-
Seller's Agent in 2017
Nick Cantave
Cantave Realty Group, Inc.
(781) 725-2172
-
John Somyk
J
Buyer's Agent in 2017
John Somyk
Keller Williams Realty Leading Edge
3 Total Sales
Map
Source: MLS Property Information Network (MLS PIN)
MLS Number: 72191264
APN: ATTL-000001-000000-000071
Disclaimer: Certain information contained herein is derived from information provided by parties other than Homes.com. All information provided is deemed reliable, but is not guaranteed to be accurate and should be independently verified.
![]() The property listing data and information, or the Images, set forth herein were provided to MLS Property Information Network, Inc. from third party sources, including sellers, lessors and public records, and were compiled by MLS Property Information Network, Inc. The property listing data and information, and the Images, are for the personal, non-commercial use of consumers having a good faith interest in purchasing or leasing listed properties of the type displayed to them and may not be used for any purpose other than to identify prospective properties which such consumers may have a good faith interest in purchasing or leasing. MLS Property Information Network, Inc. and its subscribers disclaim any and all representations and warranties as to the accuracy of the property listing data and information, or as to the accuracy of any of the Images, set forth herein.
The property listing data and information, or the Images, set forth herein were provided to MLS Property Information Network, Inc. from third party sources, including sellers, lessors and public records, and were compiled by MLS Property Information Network, Inc. The property listing data and information, and the Images, are for the personal, non-commercial use of consumers having a good faith interest in purchasing or leasing listed properties of the type displayed to them and may not be used for any purpose other than to identify prospective properties which such consumers may have a good faith interest in purchasing or leasing. MLS Property Information Network, Inc. and its subscribers disclaim any and all representations and warranties as to the accuracy of the property listing data and information, or as to the accuracy of any of the Images, set forth herein.
Nearby Homes
- 12 W Carpenter St
- 22 W Carpenter St
- 22 W Carpenter St Unit 3
- 22 W Carpenter St Unit 16
- 22 W Carpenter St Unit 2
- 11 W Carpenter St
- 4 W Carpenter St
- 25 Lord St
- 25 Lord St Unit 1
- 33 Lord St
- 29 Lord St
- 19 W Carpenter St
- 19 W Carpenter St Unit 1
- 37 Lord St
- 21 W Carpenter St
- 23 Lord St
- 35 Lord St
- 24 W Carpenter St
- 15 Lord St
- 30 Lord St