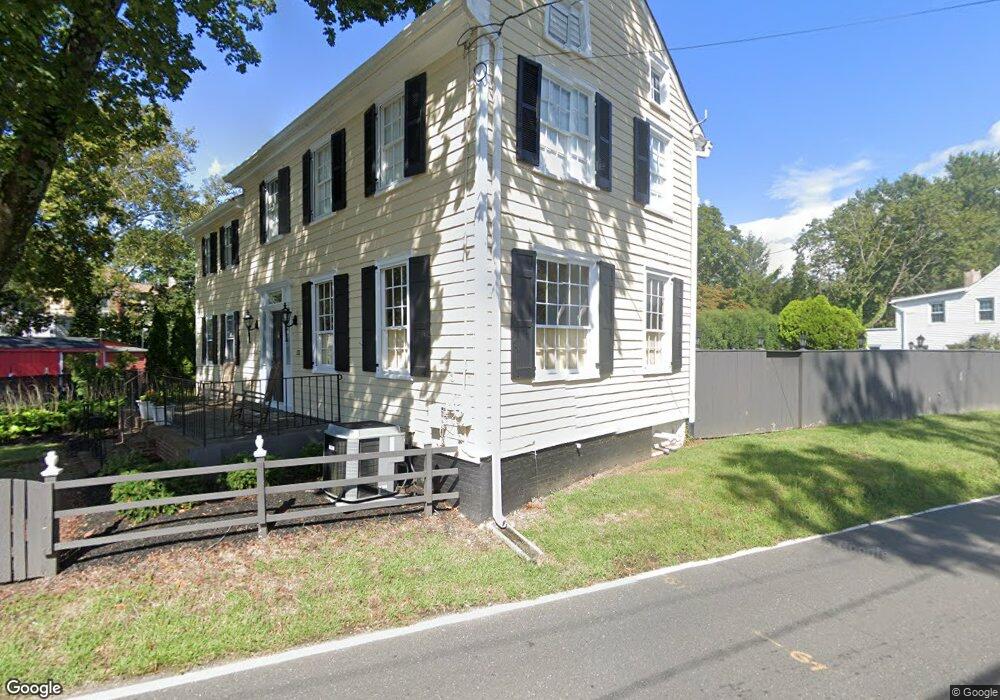
12 Waker Ave Unit 1 Allentown, NJ 08501
Estimated Value: $583,000 - $666,168
4
Beds
3
Baths
2,576
Sq Ft
$244/Sq Ft
Est. Value
About This Home
This home is located at 12 Waker Ave Unit 1, Allentown, NJ 08501 and is currently estimated at $628,542, approximately $243 per square foot. 12 Waker Ave Unit 1 is a home located in Monmouth County with nearby schools including Newell Elementary School, Stonebridge Middle School, and Allentown High School.
Ownership History
Date
Name
Owned For
Owner Type
Purchase Details
Closed on
Aug 20, 2020
Sold by
Hunter Jean P
Bought by
Cook Meredith C
Current Estimated Value
Home Financials for this Owner
Home Financials are based on the most recent Mortgage that was taken out on this home.
Original Mortgage
$271,200
Outstanding Balance
$240,125
Interest Rate
2.9%
Mortgage Type
New Conventional
Estimated Equity
$388,417
Purchase Details
Closed on
Jun 1, 1981
Bought by
Hunter Jean P
Create a Home Valuation Report for This Property
The Home Valuation Report is an in-depth analysis detailing your home's value as well as a comparison with similar homes in the area
Home Values in the Area
Average Home Value in this Area
Purchase History
| Date | Buyer | Sale Price | Title Company |
|---|---|---|---|
| Cook Meredith C | $339,000 | Foundation Title Llc | |
| Hunter Jean P | $63,000 | -- |
Source: Public Records
Mortgage History
| Date | Status | Borrower | Loan Amount |
|---|---|---|---|
| Open | Cook Meredith C | $271,200 |
Source: Public Records
Tax History Compared to Growth
Tax History
| Year | Tax Paid | Tax Assessment Tax Assessment Total Assessment is a certain percentage of the fair market value that is determined by local assessors to be the total taxable value of land and additions on the property. | Land | Improvement |
|---|---|---|---|---|
| 2025 | $10,343 | $321,400 | $112,100 | $209,300 |
| 2024 | $9,250 | $321,400 | $112,100 | $209,300 |
| 2023 | $9,250 | $321,400 | $112,100 | $209,300 |
| 2022 | $9,532 | $321,400 | $112,100 | $209,300 |
| 2021 | $9,532 | $315,000 | $112,100 | $202,900 |
| 2020 | $9,296 | $315,000 | $112,100 | $202,900 |
| 2019 | $9,541 | $315,000 | $112,100 | $202,900 |
| 2018 | $9,595 | $315,000 | $112,100 | $202,900 |
| 2017 | $9,601 | $315,000 | $112,100 | $202,900 |
| 2016 | $9,582 | $315,000 | $112,100 | $202,900 |
| 2015 | $8,838 | $312,200 | $112,100 | $200,100 |
| 2014 | $8,721 | $310,700 | $112,100 | $198,600 |
Source: Public Records
Map
Nearby Homes
- 35 Church St
- 3 Johnson Dr
- 11 Probasco Dr
- 8 Coates Rd
- 30 Ridgeview Way
- 164 Ellisdale Rd
- 81 Potts Rd
- 33 Bunker Hill Dr
- 40 Bunker Hill Dr
- 45 Circle Dr
- 10 Powderhorn Way
- 79 Potts Rd
- 9 Woodfield Ln
- 41 Gina Dr
- 467 Gordon Rd
- 2 Chambers Ct
- 3 Dartmouth Ct
- 7 Corral Dr
- 9 Meetinghouse Rd
- STONEHAVEN II Plan at Old York Estates