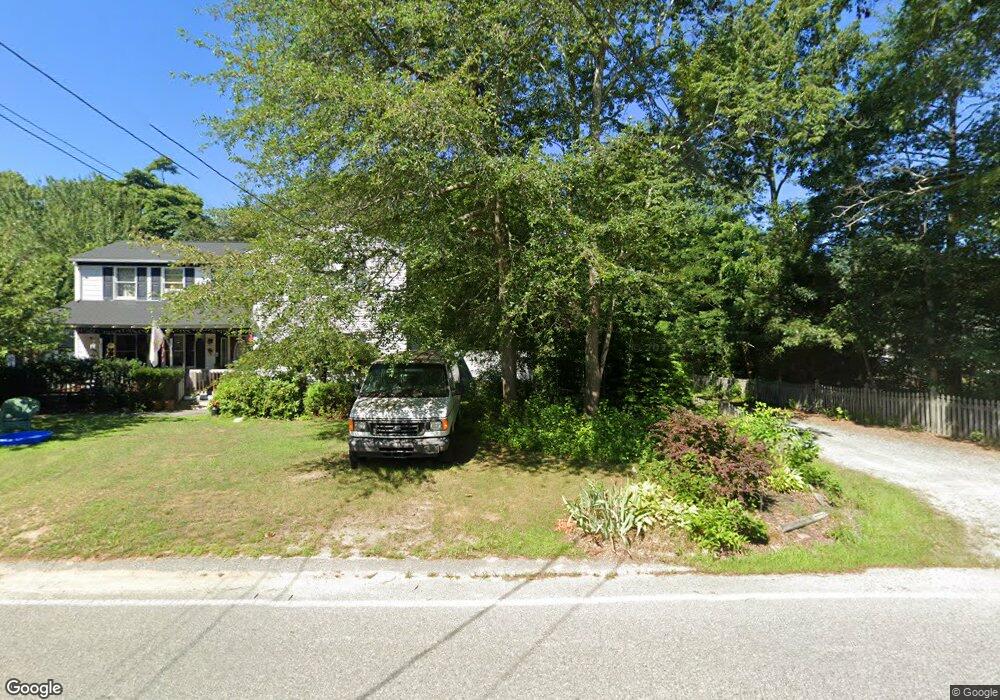
12 Weaver St West Wareham, MA 02576
Estimated Value: $545,000 - $602,000
3
Beds
3
Baths
1,836
Sq Ft
$312/Sq Ft
Est. Value
About This Home
This home is located at 12 Weaver St, West Wareham, MA 02576 and is currently estimated at $573,411, approximately $312 per square foot. 12 Weaver St is a home located in Plymouth County.
Ownership History
Date
Name
Owned For
Owner Type
Purchase Details
Closed on
Jan 25, 2017
Sold by
12 Weaver St T and Natsios
Bought by
Nardi Melanie and Jensen Keith
Current Estimated Value
Home Financials for this Owner
Home Financials are based on the most recent Mortgage that was taken out on this home.
Original Mortgage
$272,727
Outstanding Balance
$224,461
Interest Rate
4.16%
Mortgage Type
New Conventional
Estimated Equity
$348,950
Purchase Details
Closed on
Jun 1, 2016
Sold by
Prof-2013-S3 Reo 1 Llc
Bought by
Doherty James
Home Financials for this Owner
Home Financials are based on the most recent Mortgage that was taken out on this home.
Original Mortgage
$170,000
Interest Rate
3.59%
Mortgage Type
New Conventional
Purchase Details
Closed on
Feb 24, 2015
Sold by
Onanian Scott A and Onanian Scott
Bought by
Prof Reo 1 Llc
Purchase Details
Closed on
Oct 30, 2006
Sold by
Tavares Jack
Bought by
Onanian Scott
Home Financials for this Owner
Home Financials are based on the most recent Mortgage that was taken out on this home.
Original Mortgage
$310,000
Interest Rate
6.48%
Mortgage Type
Purchase Money Mortgage
Create a Home Valuation Report for This Property
The Home Valuation Report is an in-depth analysis detailing your home's value as well as a comparison with similar homes in the area
Home Values in the Area
Average Home Value in this Area
Purchase History
| Date | Buyer | Sale Price | Title Company |
|---|---|---|---|
| Nardi Melanie | $270,000 | -- | |
| Nardi Melanie | $270,000 | -- | |
| Doherty James | $136,930 | -- | |
| Doherty James | $136,930 | -- | |
| Prof Reo 1 Llc | -- | -- | |
| Prof Reo 1 Llc | -- | -- | |
| Onanian Scott | $310,000 | -- | |
| Onanian Scott | $310,000 | -- |
Source: Public Records
Mortgage History
| Date | Status | Borrower | Loan Amount |
|---|---|---|---|
| Open | Nardi Melanie | $272,727 | |
| Closed | Nardi Melanie | $272,727 | |
| Previous Owner | Doherty James | $170,000 | |
| Previous Owner | Onanian Scott | $310,000 |
Source: Public Records
Tax History
| Year | Tax Paid | Tax Assessment Tax Assessment Total Assessment is a certain percentage of the fair market value that is determined by local assessors to be the total taxable value of land and additions on the property. | Land | Improvement |
|---|---|---|---|---|
| 2025 | $5,129 | $492,200 | $116,400 | $375,800 |
| 2024 | $5,278 | $470,000 | $93,100 | $376,900 |
| 2023 | $4,948 | $411,300 | $84,700 | $326,600 |
| 2022 | $5,051 | $383,200 | $84,700 | $298,500 |
| 2021 | $4,399 | $327,100 | $84,700 | $242,400 |
| 2020 | $4,072 | $307,100 | $84,700 | $222,400 |
| 2019 | $3,790 | $285,200 | $86,400 | $198,800 |
| 2018 | $3,833 | $281,200 | $86,400 | $194,800 |
| 2017 | $3,623 | $269,400 | $86,400 | $183,000 |
| 2016 | $3,350 | $247,600 | $86,400 | $161,200 |
| 2015 | $3,315 | $253,600 | $86,400 | $167,200 |
| 2014 | $3,423 | $266,400 | $86,400 | $180,000 |
Source: Public Records
Map
Nearby Homes
Your Personal Tour Guide
Ask me questions while you tour the home.