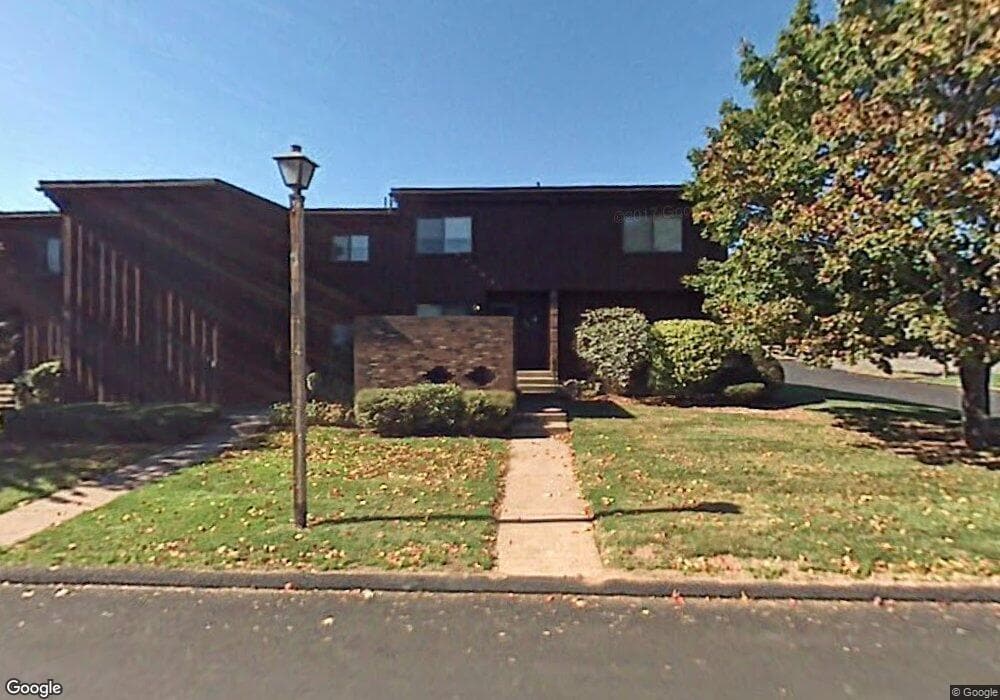
12 Webster Ct Unit 12 Newington, CT 06111
Estimated Value: $235,000 - $259,000
2
Beds
2
Baths
627
Sq Ft
$391/Sq Ft
Est. Value
About This Home
This home is located at 12 Webster Ct Unit 12, Newington, CT 06111 and is currently estimated at $245,067, approximately $390 per square foot. 12 Webster Ct Unit 12 is a home located in Hartford County with nearby schools including John Paterson School, John Wallace Middle School, and Newington High School.
Ownership History
Date
Name
Owned For
Owner Type
Purchase Details
Closed on
Nov 15, 2006
Sold by
Saladin-Fairseruis Dawn
Bought by
Westermeyer Jeffrey P
Current Estimated Value
Home Financials for this Owner
Home Financials are based on the most recent Mortgage that was taken out on this home.
Original Mortgage
$147,000
Outstanding Balance
$87,086
Interest Rate
6.33%
Estimated Equity
$157,981
Purchase Details
Closed on
Jun 1, 2001
Sold by
Hoang Brenda L
Bought by
Saladin Dawn L
Home Financials for this Owner
Home Financials are based on the most recent Mortgage that was taken out on this home.
Original Mortgage
$87,200
Interest Rate
7.09%
Purchase Details
Closed on
Jan 23, 1998
Sold by
Tague Cynthia
Bought by
Bosco Brenda L
Home Financials for this Owner
Home Financials are based on the most recent Mortgage that was taken out on this home.
Original Mortgage
$63,000
Interest Rate
6.63%
Mortgage Type
Unknown
Create a Home Valuation Report for This Property
The Home Valuation Report is an in-depth analysis detailing your home's value as well as a comparison with similar homes in the area
Home Values in the Area
Average Home Value in this Area
Purchase History
| Date | Buyer | Sale Price | Title Company |
|---|---|---|---|
| Westermeyer Jeffrey P | $155,000 | -- | |
| Saladin Dawn L | $89,900 | -- | |
| Bosco Brenda L | $64,500 | -- |
Source: Public Records
Mortgage History
| Date | Status | Borrower | Loan Amount |
|---|---|---|---|
| Open | Bosco Brenda L | $147,000 | |
| Previous Owner | Bosco Brenda L | $87,200 | |
| Previous Owner | Bosco Brenda L | $63,000 | |
| Previous Owner | Bosco Brenda L | $77,900 |
Source: Public Records
Tax History Compared to Growth
Tax History
| Year | Tax Paid | Tax Assessment Tax Assessment Total Assessment is a certain percentage of the fair market value that is determined by local assessors to be the total taxable value of land and additions on the property. | Land | Improvement |
|---|---|---|---|---|
| 2025 | $2,125 | $53,140 | $0 | $53,140 |
| 2024 | $3,549 | $89,470 | $0 | $89,470 |
| 2023 | $3,432 | $89,470 | $0 | $89,470 |
| 2022 | $3,444 | $89,470 | $0 | $89,470 |
| 2021 | $3,472 | $89,470 | $0 | $89,470 |
| 2020 | $3,635 | $92,540 | $0 | $92,540 |
| 2019 | $3,651 | $92,540 | $0 | $92,540 |
| 2018 | $3,563 | $92,540 | $0 | $92,540 |
| 2017 | $3,386 | $92,540 | $0 | $92,540 |
| 2016 | $3,308 | $92,540 | $0 | $92,540 |
| 2014 | $3,175 | $91,320 | $0 | $91,320 |
Source: Public Records
Map
Nearby Homes
- 177 Culver St Unit 177
- 660/674 Church Rear St
- 78 Apple Hill
- 19 Sunnybrook Dr
- 9 Coachmen Ln
- 53 Salem Dr
- 44 Trotter Ln
- 28 Kelsey St
- 61 Long St
- 516 Wethersfield Rd
- 212 Church St
- 57 Stonehedge Dr
- 277 Orchard Ave
- 26 Pickens Dr
- 0 Country Ct Unit 134 24089873
- 0 Country Ct Unit 137 24077628
- 43 Steeplechase Dr Unit 43
- 500 Holly Hill Dr
- 149 Foxboro Dr Unit 149
- 120 Fox Run Ct
- 12 Webster Ct
- 11 Webster Ct
- 10 Webster Ct
- 9 Webster Ct
- 9 Webster Ct Unit 9
- 8 Webster Ct
- 8 Webster Ct Unit 8
- 7 Webster Ct
- 133 Webster Ct
- 15 Webster Ct
- 14 Webster Ct
- 5 Webster Ct
- 131 Webster Ct
- 134 Webster Ct
- 6 Webster Ct
- 3 Webster Ct
- 132 Webster Ct
- 132 Webster Ct Unit A
- 132 Webster Ct Unit 132
- 135 Webster Ct