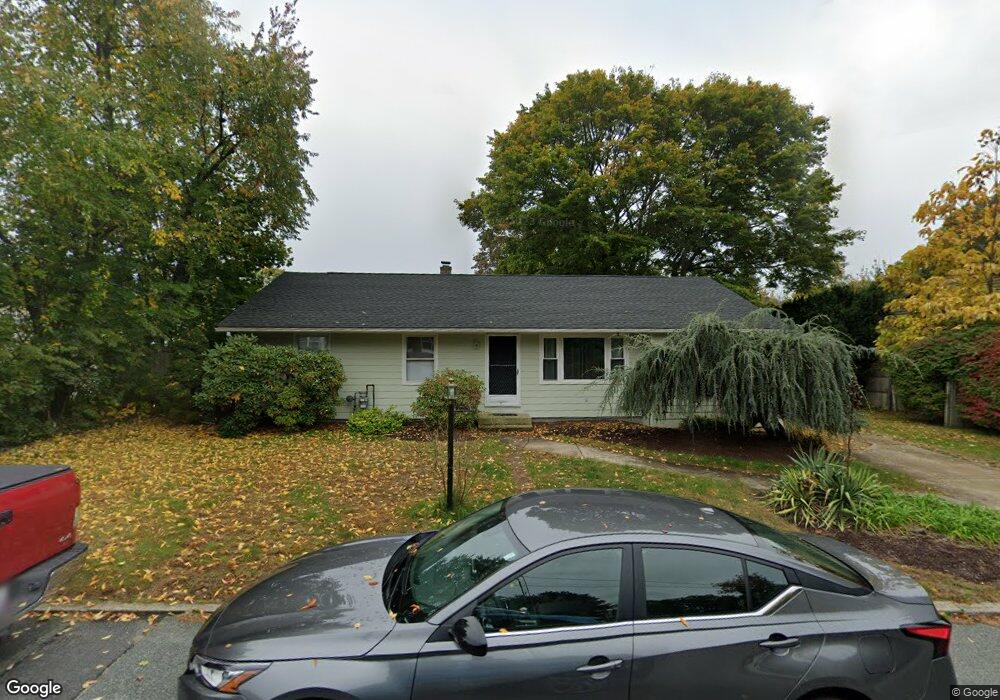
12 Willow Rd Cranston, RI 02920
Garden Hills NeighborhoodEstimated Value: $396,000 - $456,000
3
Beds
2
Baths
2,300
Sq Ft
$188/Sq Ft
Est. Value
About This Home
This home is located at 12 Willow Rd, Cranston, RI 02920 and is currently estimated at $431,457, approximately $187 per square foot. 12 Willow Rd is a home located in Providence County with nearby schools including Glen Hills School, Western Hills Middle School, and Cranston High School West.
Ownership History
Date
Name
Owned For
Owner Type
Purchase Details
Closed on
Jul 28, 2017
Sold by
Jones&Bond Hldg Co Llc
Bought by
Perez Charilan
Current Estimated Value
Home Financials for this Owner
Home Financials are based on the most recent Mortgage that was taken out on this home.
Original Mortgage
$195,000
Outstanding Balance
$162,101
Interest Rate
3.91%
Mortgage Type
Purchase Money Mortgage
Estimated Equity
$269,356
Purchase Details
Closed on
Sep 16, 2011
Sold by
Caprio Anthony M
Bought by
Jones&Bond Hldg Co Llc
Purchase Details
Closed on
Jul 27, 2011
Sold by
Weinstein Jonathan
Bought by
Oaklawn Dev Llc
Purchase Details
Closed on
Apr 14, 2010
Sold by
Ponder Tammy and Ponder Curtis
Bought by
Midfirst Bk
Purchase Details
Closed on
Dec 22, 2009
Sold by
Ponder Curtis R and Ponder Tammy
Bought by
Midfirst Bk
Purchase Details
Closed on
Apr 16, 2001
Sold by
Ryan John P and Ryan Donna
Bought by
Ponder Ii Curtis K and Ponder Tammy
Purchase Details
Closed on
Oct 18, 1991
Sold by
Murtagh John F
Bought by
Faiolaa Gennaro
Create a Home Valuation Report for This Property
The Home Valuation Report is an in-depth analysis detailing your home's value as well as a comparison with similar homes in the area
Home Values in the Area
Average Home Value in this Area
Purchase History
| Date | Buyer | Sale Price | Title Company |
|---|---|---|---|
| Perez Charilan | $200,000 | -- | |
| Jones&Bond Hldg Co Llc | -- | -- | |
| Jones&Bond Hldg Co Llc | -- | -- | |
| Oaklawn Dev Llc | -- | -- | |
| Midfirst Bk | $248,500 | -- | |
| Midfirst Bk | $244,500 | -- | |
| Ponder Ii Curtis K | $150,000 | -- | |
| Faiolaa Gennaro | $119,000 | -- |
Source: Public Records
Mortgage History
| Date | Status | Borrower | Loan Amount |
|---|---|---|---|
| Open | Faiolaa Gennaro | $195,000 | |
| Previous Owner | Faiolaa Gennaro | $211,373 |
Source: Public Records
Tax History
| Year | Tax Paid | Tax Assessment Tax Assessment Total Assessment is a certain percentage of the fair market value that is determined by local assessors to be the total taxable value of land and additions on the property. | Land | Improvement |
|---|---|---|---|---|
| 2025 | $4,521 | $325,700 | $104,300 | $221,400 |
| 2024 | $4,433 | $325,700 | $104,300 | $221,400 |
| 2023 | $4,438 | $234,800 | $72,000 | $162,800 |
| 2022 | $4,346 | $234,800 | $72,000 | $162,800 |
| 2021 | $4,226 | $234,800 | $72,000 | $162,800 |
| 2020 | $3,977 | $191,500 | $68,400 | $123,100 |
| 2019 | $4,218 | $203,100 | $68,400 | $134,700 |
| 2018 | $4,121 | $203,100 | $68,400 | $134,700 |
| 2017 | $3,420 | $149,100 | $50,400 | $98,700 |
| 2016 | $3,347 | $149,100 | $50,400 | $98,700 |
| 2015 | $3,347 | $149,100 | $50,400 | $98,700 |
| 2014 | $3,282 | $143,700 | $50,400 | $93,300 |
Source: Public Records
Map
Nearby Homes
- 14 Amanda St
- 78 Wilbur Ave
- 46 Hornbeam Dr
- 20 Manilla Ave
- 50 Briarwood Rd
- 52 Cottonwood Dr
- 64 Cliffside Dr
- 1027 Providence St Unit 4B
- 82 Mountain Laurel Dr
- 10 East St Unit 316
- 157 Sweetbriar Dr
- 42 Woodland Dr
- 14 W Natick Rd
- 1100 Phenix Ave
- 61 Crossland Rd
- 36 Bleachery Ct
- 217 Belvedere Dr
- 1213 Phenix Ave
- 0 Natick Rd
- 27 Shean St
- 15 Westbrook Rd
- 1055 Oaklawn Ave
- 20 Willow Rd
- 21 Westbrook Rd
- 1063 Oaklawn Ave
- 25 Westbrook Rd
- 14 Westbrook Rd
- 1033 Oaklawn Ave
- 22 Westbrook Rd
- 1050 Oaklawn Ave
- 1060 Oaklawn Ave
- 1040 Oaklawn Ave
- 1068 Oaklawn Ave
- 38 Ellison St
- 42 Ellison St
- 48 Ellison St
- 32 Ellison St
- 15 Fairway Dr
- 11 Fairway Dr
- 54 Ellison St
Your Personal Tour Guide
Ask me questions while you tour the home.