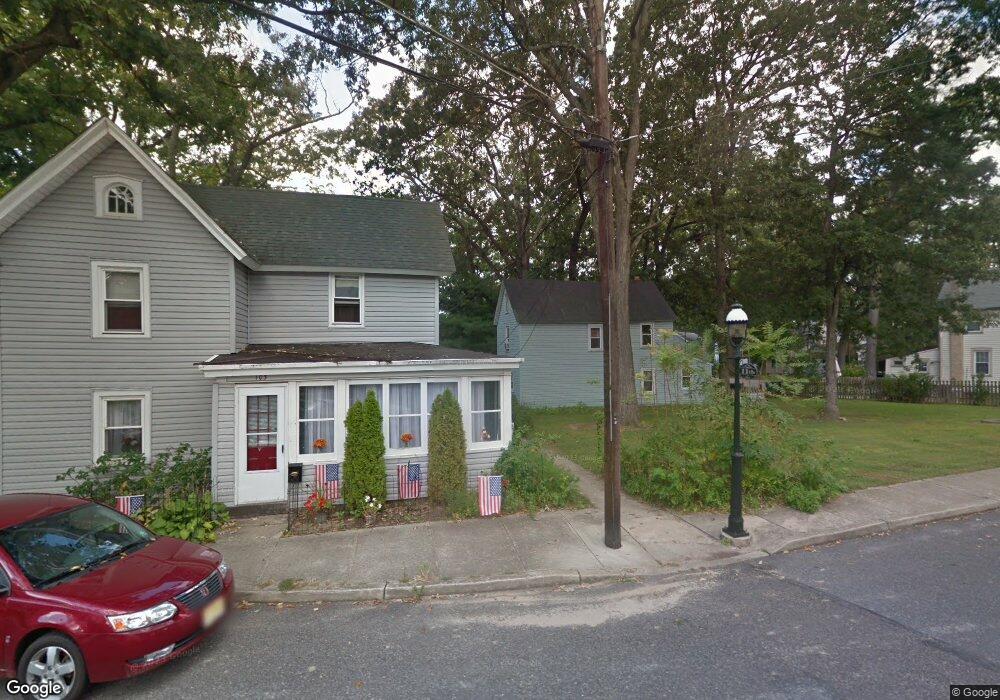
120 11th Ave Pitman, NJ 08071
Estimated Value: $204,000 - $245,000
2
Beds
1
Bath
876
Sq Ft
$256/Sq Ft
Est. Value
About This Home
This home is located at 120 11th Ave, Pitman, NJ 08071 and is currently estimated at $223,980, approximately $255 per square foot. 120 11th Ave is a home located in Gloucester County with nearby schools including W.C.K. Walls Elementary School, Pitman Middle School, and Pitman High School.
Ownership History
Date
Name
Owned For
Owner Type
Purchase Details
Closed on
Dec 21, 2011
Sold by
Cappello Gregory J and Cappello Sherry
Bought by
Cioffi William
Current Estimated Value
Purchase Details
Closed on
Aug 1, 2002
Sold by
Burger Kathleen
Bought by
Cappello Gregory J and Cappello Sherry
Home Financials for this Owner
Home Financials are based on the most recent Mortgage that was taken out on this home.
Original Mortgage
$32,000
Interest Rate
6.58%
Create a Home Valuation Report for This Property
The Home Valuation Report is an in-depth analysis detailing your home's value as well as a comparison with similar homes in the area
Home Values in the Area
Average Home Value in this Area
Purchase History
| Date | Buyer | Sale Price | Title Company |
|---|---|---|---|
| Cioffi William | $27,300 | None Available | |
| Cappello Gregory J | $40,000 | -- |
Source: Public Records
Mortgage History
| Date | Status | Borrower | Loan Amount |
|---|---|---|---|
| Previous Owner | Cappello Gregory J | $32,000 |
Source: Public Records
Tax History
| Year | Tax Paid | Tax Assessment Tax Assessment Total Assessment is a certain percentage of the fair market value that is determined by local assessors to be the total taxable value of land and additions on the property. | Land | Improvement |
|---|---|---|---|---|
| 2025 | $3,856 | $110,400 | $24,000 | $86,400 |
| 2024 | $3,755 | $110,400 | $24,000 | $86,400 |
| 2023 | $3,755 | $110,400 | $24,000 | $86,400 |
| 2022 | $3,607 | $110,400 | $24,000 | $86,400 |
| 2021 | $3,028 | $70,000 | $19,800 | $50,200 |
| 2020 | $3,101 | $70,000 | $19,800 | $50,200 |
| 2019 | $3,028 | $70,000 | $19,800 | $50,200 |
| 2018 | $2,977 | $70,000 | $19,800 | $50,200 |
| 2017 | $2,940 | $70,000 | $19,800 | $50,200 |
| 2016 | $2,883 | $70,000 | $19,800 | $50,200 |
| 2015 | $2,806 | $70,000 | $19,800 | $50,200 |
| 2014 | $2,720 | $70,000 | $19,800 | $50,200 |
Source: Public Records
Map
Nearby Homes